


5 Critical Levels: Accelerated Selloff or Bounce Decider
Prices on the Edge of Critical Support Levels


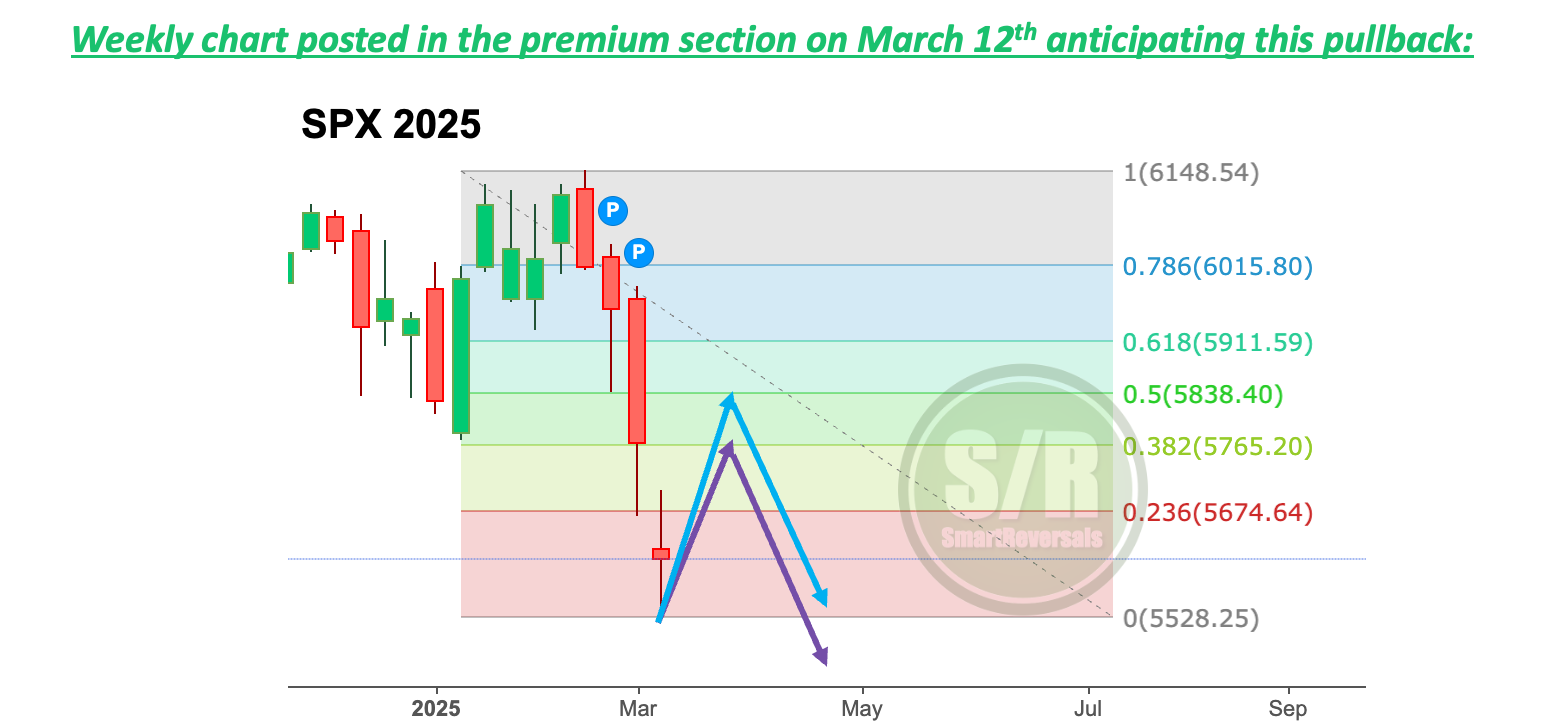
The bounce anticipated last weekend happened and it vanished following the roadmap shared two weeks ago when the SPX reached the $5500 zone for the first time this year. The expectation for a short lived bounce occurred, following the pathway charted on March 12th in a publication that analyzed how the first stage of different bear markets. The results are remarkable following the weakest pathway charted back then. To access the bear markets study click here.
A key element to consider: Rapid reversals
Last Monday the market soared in a single day +1.76%, by Tuesday the bullish target had been reached, so the decline was technically following the pathway, but it was happening too fast. Rapid rejections are the inverse price action that you find in a bull market, when any pullback is rapidly bought, that is another reference of the change of character nowadays, and consistent with my documented expectations of a significant pullback; as posted at the end of 2024, and during all February.
There are two notable factors affecting the market directly, the first one is the macro context, and in February all the leading indicators analyzed pointed to an impact in the stock market. The yield curve un-inversion was just one of the first ones flagging warnings last year, but month by month six other indicators also raised warning signs. For access to the latest macro publication click here. The tariffs set by the U.S. government are accelerating the negative macro context and the PCE reading yesterday above expectations is consistent with the warnings.
On the other hand, price action is falling from overheated conditions, potentially triggering bearish signals like studied last Wednesday, in a special edition analyzing what follows when there is a death cross based in a decade of data studied for SPX, NDX, IWM, AAPL, NVDA, and other essential securities. For access click here.
Let’s begin with the technical analysis for 20+ charts that are constantly studied, You you can find which ones are in bearish mode like most of stocks, which ones are in bullish momentum like precious metals; and those consolidating like Bitcoin.
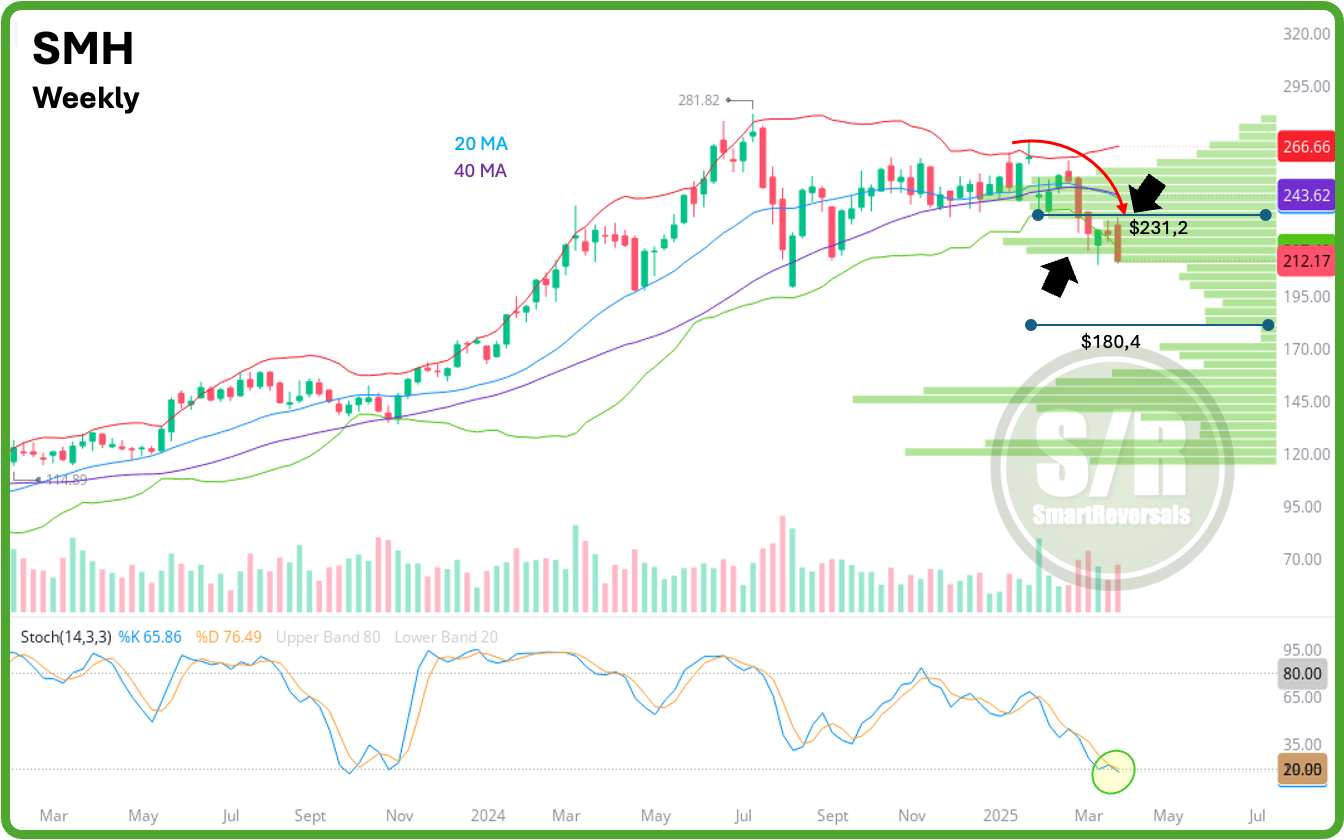
Semiconductors (SMH): The analogy drawn between the current AI sector and the 2000 dot-com bubble warrants examination. Notwithstanding potential overvaluation in semiconductor equities, these entities demonstrate robust financial statements and operational fundamentals, a stark contrast to the revenue-deficient websites of the 2000 era.
This publication utilizes the SMH ETF as a proxy for the semiconductor sector, which includes prominent stocks such as Nvidia, Taiwan Semiconductor, Broadcom, and Qualcomm, as delineated in the accompanying table. The sector's current average price-to-earnings ratio of 35, while elevated, is significantly different from the unsustainable valuations around 200 observed during the 2000 Nasdaq peak.
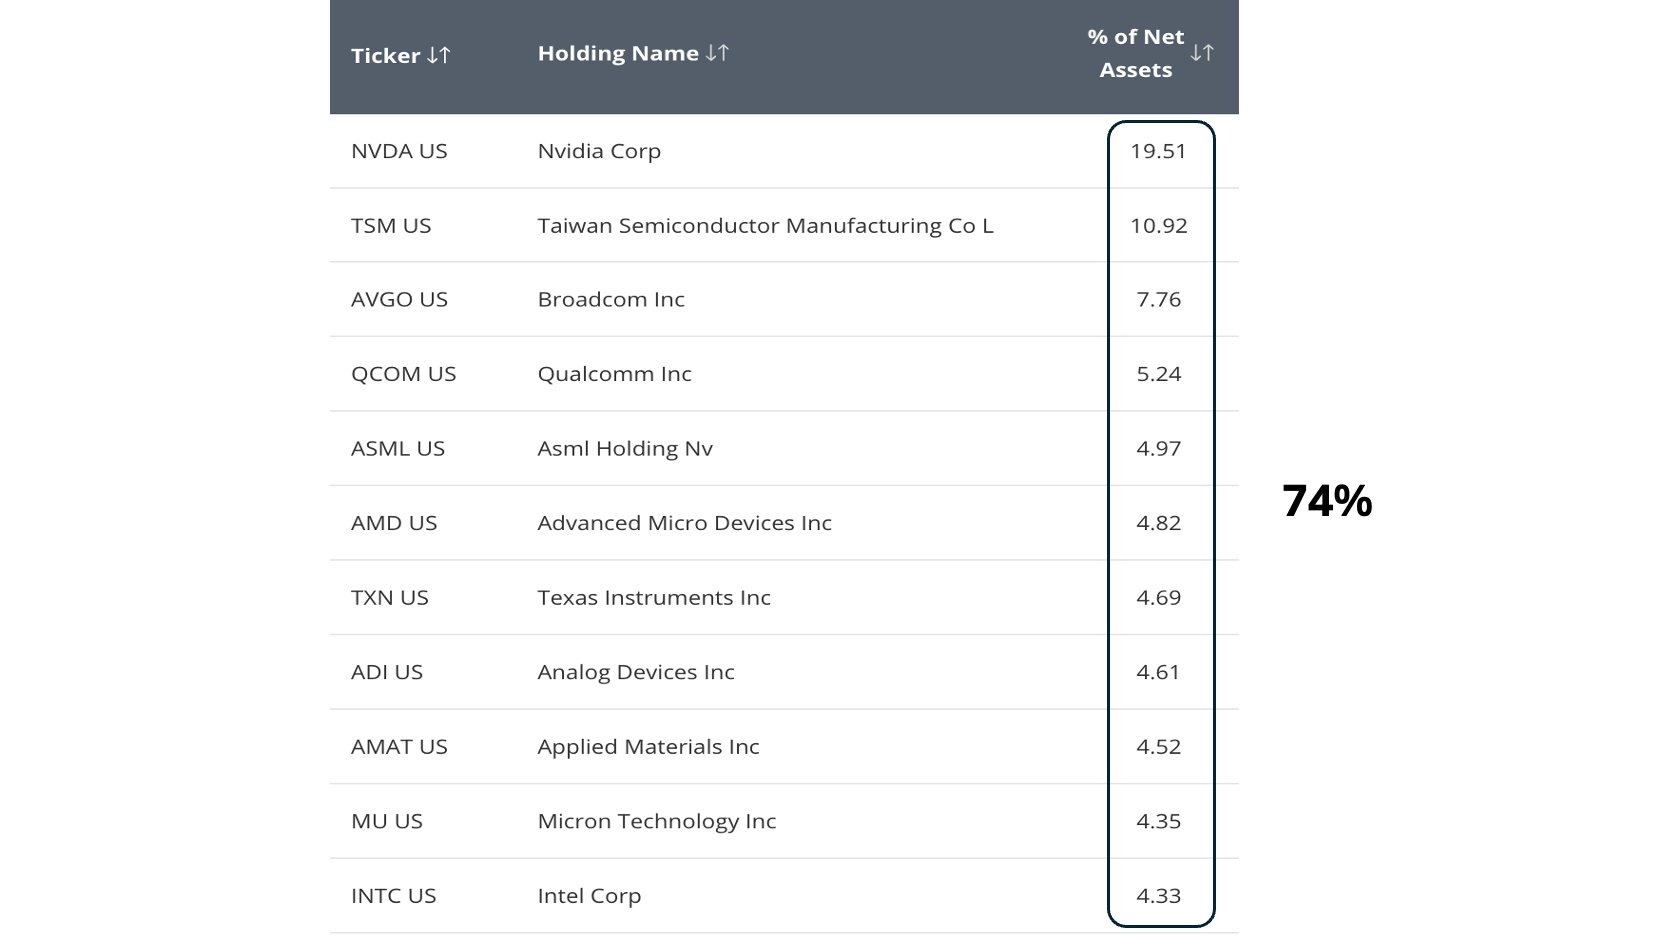
What is happening in price action is painful, but a -78% decline as observed in the 2000s for Nasdaq is fundamentally improbable. For access to fundamental analysis for semiconductor companies like NVDA, AVGO, MU, INTL, TXN, and AMD, get access to the fundamental and macro library, or click here.
Technically speaking, the series of lower highs is clear for semiconductors as highlighted by the red curved arrow, and every top has been signaled by an indecision candle. Price is oversold already, and right on the lower edge of the volume shelf.
$231 as annual level, posted since January, has proven to be a major resistance during the last four weeks, today the candle breached the lower weekly Bollinger band that is widening.
Bearish continuation is expected if price continues below $218.5, targeting $204.6, where a corrective bounce is possible, if it recovers $218.5 (which is difficult, and another rejection could happen there), the bullish reversal target would be $226.
The same in-depth charts and analysis describing the current setups, with price targets and key support and resistance levels continues for SPX, VIX, NDX, IWM, DJI, PLTR, DXY, GLD, SLV, TLT, MSTR, GOOG, AAPL, NVDA, META, MSFT, TSLA, AMZN, and BTC; with volatility and breadth indicators analyzed. If you actively invest or trade any of these securities, this publication is essential for making informed investment decisions.
Last week the charts for everyone were Dow Jones and IWM (click here); both are analyzed below, and the bullish thesis for IWM still has a small probability described below.
SPX: The week began with gains as anticipated last Saturday, when a bounce was deemed very likely with $5,777 as a target set in the same publication. Monday opened with a gap in the daily timeframe and as also anticipated, the VIX could find support at two levels: 19, or 17. (for next week levels click here)
The low for the volatility index (VIX) was precisely 16.97; coinciding perfectly with the moment the $5,777 target was achieved ($5,783 to be exact, just 6 points of distance), triggering a bearish price action. Today the bearish engulfing candle suggests further negative continuation, closing with conviction at the week's low. Before analyzing next week's target, let's examine the four events highlighted by the black arrows in the chart: