


A Study of Bounces Across Six Major Market Corrections
Is this a Potential Bear Market Bottom or Temporary Bounce?


The SPX reached $4835, very close to the $4800 target highlighted in previous analyses that raised warnings based on Elliott Wave and Fibonacci projections. For access, click here. This target was anticipated, aligning with typical patterns observed during past bear markets, including those of 2022, 2000, and even 1987. Today’s analysis focuses on navigating bear markets and anticipating their rallies, emphasizing that profit opportunities exist even within downtrends with the appropriate mindset and technical strategy.
The question remains: is the bottom in? Is today’s rally the validation of a major bottom? The current market exhibits unique characteristics compared to others. It's self-inflicted, yet it has unfolded with remarkable speed, breaking numerous technical levels and consequently inflicting significant damage on the price action structure. The bounce today was constructive, but it still has to cross a key threshold studied below with evidence from six major corrections.
Last Saturday, using the weekly Support and Resistance levels, this diagram outlining the expected price action was shared with premium subscribers, presenting three distinct scenarios, all pointing towards a lower low. Once again, the price action unfolded with exceptional speed, completing the bearish move by Tuesday, but including the bullish move today.
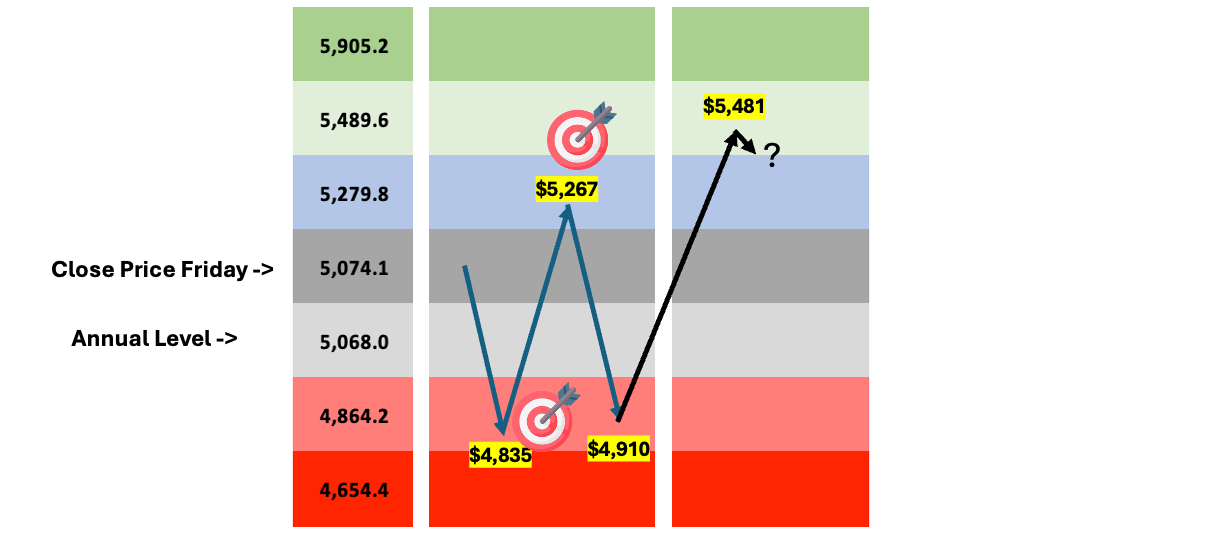
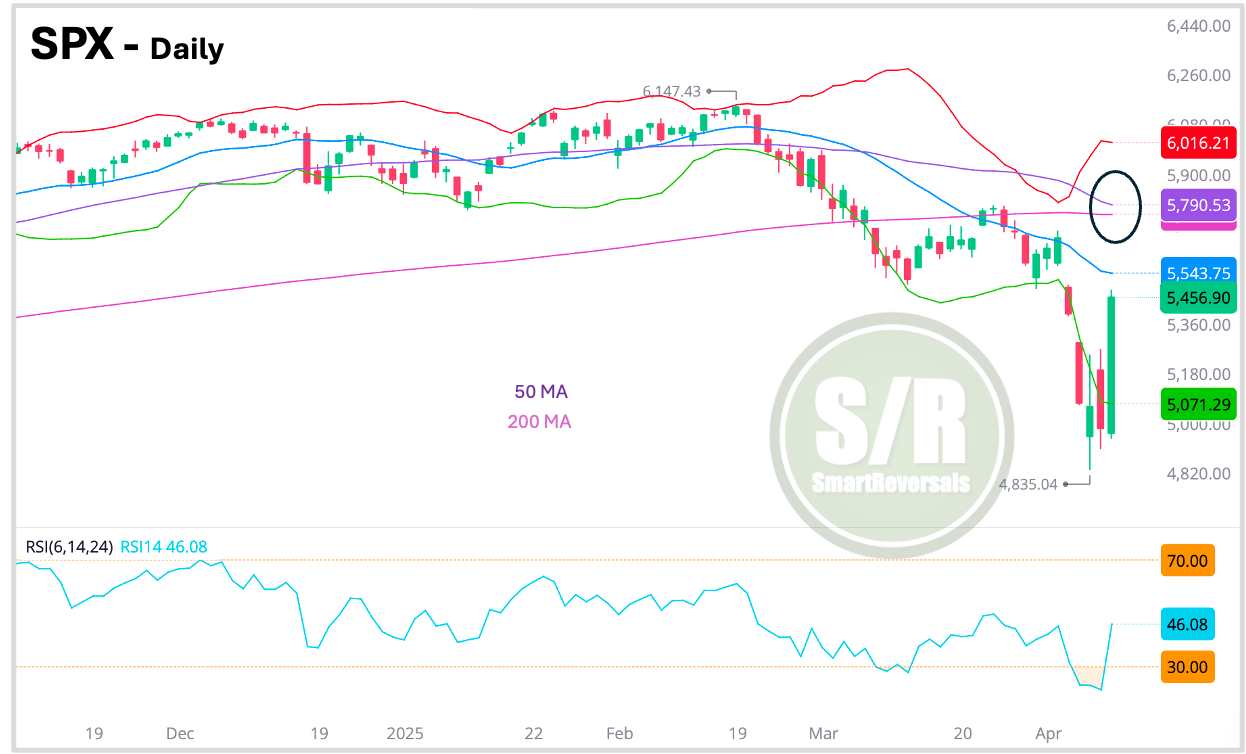
The thesis for a 8% bounce was temporarily invalidated, however, today the SPX low held at the $4,864 support level, and the subsequent rally precisely reached $5,481 before a minor pullback. What's next? This is part of the updated analysis following our study of bear market bounces. In the interim, it's crucial to remember that a bearish crossover of the 50-day and 200-day moving averages is imminent for the SPX, a signal whose significance over the past decade we analyzed just two weeks ago., for access, click here.
The latest bearish crossovers between those two averages happened in 2022, 2020, and 2018. All the three cases during major pullbacks. The bounce must continue to curl up the 50DMA (purple line).
Remember the significant pullback warnings highlighted in this publication during January and February; as the constant bullish position during 2024. This edition maintains the same objective approach, now providing specific exit levels should a downturn materialize. The current market enthusiasm mirrors the sentiment seen at the end of March 2022 and May 2000 (both in early stages of a major decline). While I would like to see a continued V-shaped recovery, this scenario requires certain validations, consistent with our previous studies, which are detailed below in the analysis of six bear markets, categorizing them into two types: A) progressive declines within technical indicator ranges, and B) "crash mode" declines characterized by rapid support level breaches. Navigating these scenarios demands distinct strategies, and a combination of both can occur (C). Continuing the study of significant bottoms for SPX, let's now explore potential market developments for today.
SPX: Critical Line for Identifying Reversals in Major Corrections