Bearish Crossover and Divergence Analysis: Market-Wide Implications
Brief Calm During the Storm: Interpreting the Main Bearish Market Trend
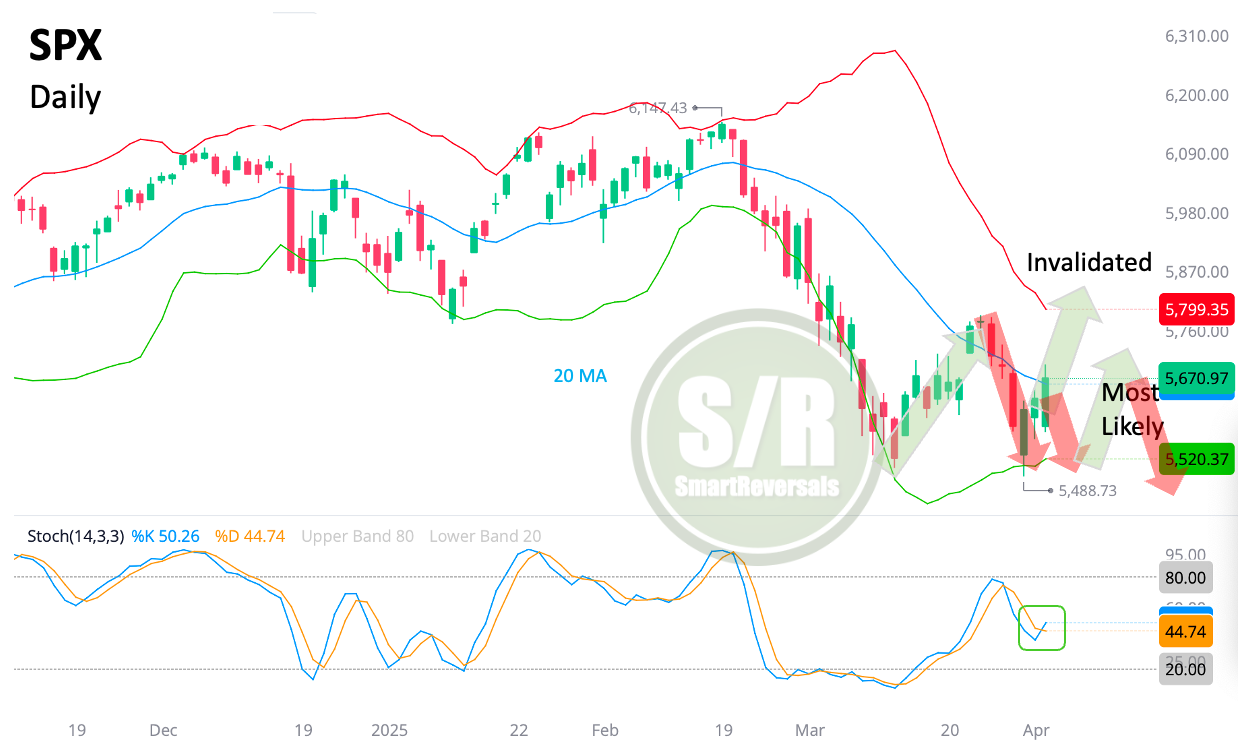
The market bounced from the bearish target highlighted last weekend; $5,506.6; today it found rejection at the 20 daily average.
A corrective bounce was expected, and this chart is consistent with the analysis posted on March 12th for premium subscribers; the blue pathway has been invalidated, we’re in the purple one. Here is the chart adjusted to the daily timeframe:
The price reached the 20-day moving average today and in after-hours it is aiming to the lower Bollinger Band again, reversing the week's upward movement. This price action reinforces the prevailing bear market conditions. Today we will study an essential pattern observed in previous cases.
What is a Crossover?
A bearish crossover is a technical analysis signal that indicates a potential shift from an uptrend to a downtrend. It occurs when a shorter-term moving average crosses below a longer-term moving average.
Last week we studied the implications of such signals between the 50 and 200 daily moving average, the content provided key elements to analyze previous major corrections for U.S. indices, stocks, and international indices. To access the publication click here.
A crossover suggests that recent price action is weakening or strengthening relative to longer-term trends, signaling potential downward momentum. It's a sign that the balance of power is shifting from buyers to sellers or vice-versa.
Today, we’ll study two technical indicators, a bearish MACD crossover and a divergence, also providing a market update using monthly charts.
Since the US market is underperforming essentially the rest of the world, let’s begin with a non US chart, because I want to highlight that the US may have begun a downtrend and other indices are very likely to follow considering purely the technical indicators.
EWJ
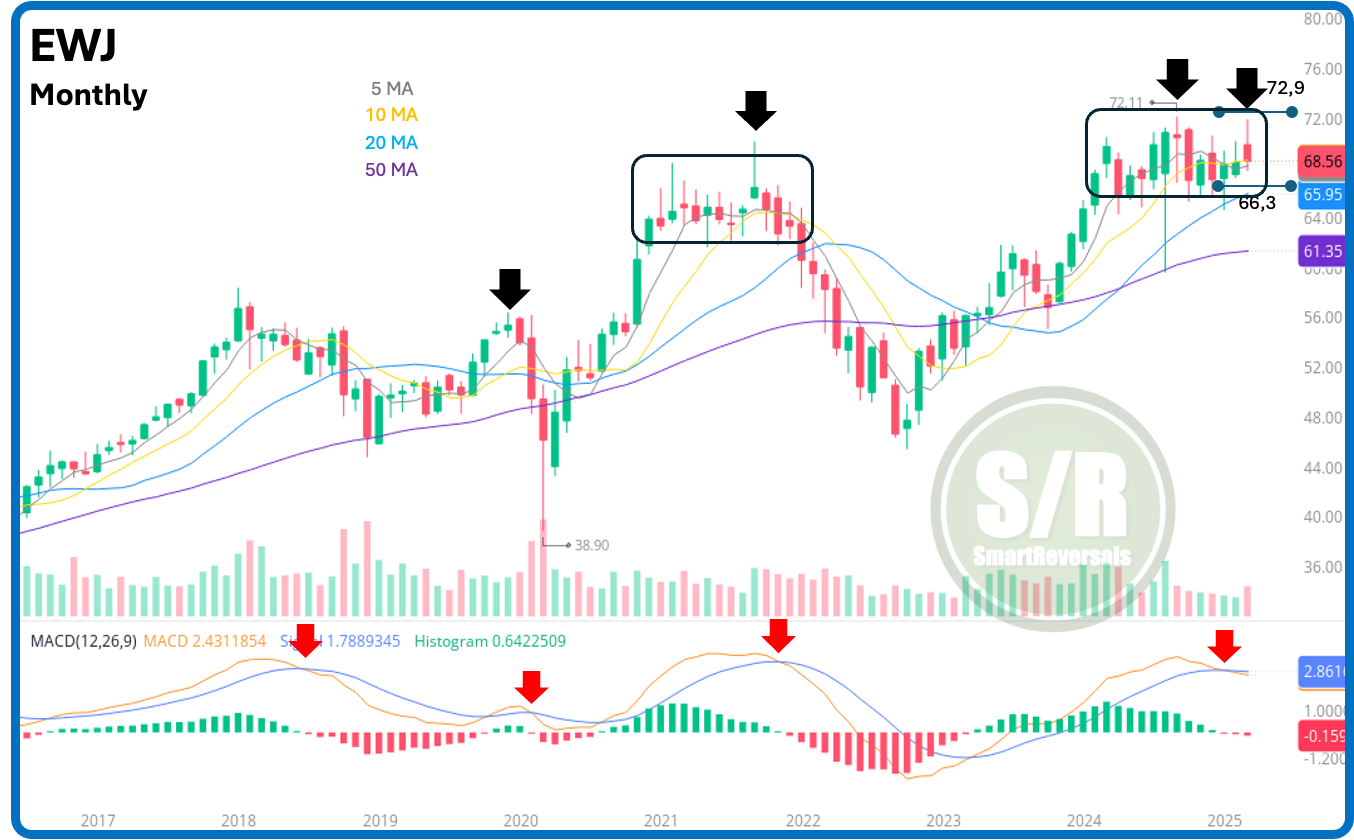
The EWJ ETF aims to mirror the MSCI Japan Index, and as you can see, the price is currently consolidating within a base, highlighted by the rectangle, much like it did during 2021.
The chart also presents three essential indicators:
Moving Averages: The short-term moving averages (5 and 10 months) are trending downwards, signaling a loss of bullish momentum; in fact, the 5-month average has already crossed below the 10-month. For educational content about moving averages, click here.
Reversal Candlesticks: Bearish reversal candlesticks, indicated by the black arrows, have served as early warning signs in the past, such as at the start of 2021 and in the second half of 2024. However, they have also marked tops, as shown by the highlighted instances. For educational content about candlesticks, click here.
Bearish MACD Crossovers: These crossovers, highlighted with red arrows, have been followed by bearish impulses, particularly when coinciding with reversal candlesticks. For educational content about oscillators, click here.
This edition continues with the analysis for EWJ, and also the charts and updated analysis for the short and long term for SPX, NDX, NVDA, Bitcoin, DAX, and Gold.
Upgrade your subscription and get access to all the educational content, and the charts analyses with price targets using technical indicators and the latest Support & Resistance levels.
Looking at EWJ, are we heading for another August 2024 situation?


