


Bounce Evaporates: Selloff Pressure Builds
Support and Resistance Levels for Next Week: March 31st - April 4th - 35 Securities Analyzed.


After a brief bounce, the SPX resumed the selloff initiated six weeks ago setting the price in correction territory with a loss of -10% of the top reached in February. The bounce anticipated last weekend happened as expected, but it vanished when the 200 daily moving average was recovered.
This publication provides objective market analysis about stock market, commodities, and crypto. During the current correction, the content has anticipated the recent market moves as follows (use the links to get access):
February 8th, anticipating the correction: Vanishing Bounces, Soaring Volatility: Is the Market About to Break?
February 26th, raising warning sides in the economy: U.S. Economy - 14 Macro Charts Analyzing the Landscape
March 5th, a study of the common patterns in bear markets: A Technical Study of Historical Corrections
March 22nd, anticipating a short term bounce: Oversold Indicators and Price Action Point to a Bounce
March 26th, a study of the key levels for SPX and NDX to invalidate the bear market thesis: Two Key Levels to Invalidate Bear Market Thesis
Subscribe, and get access to all publications, they provide a pathway to navigate the current market context.
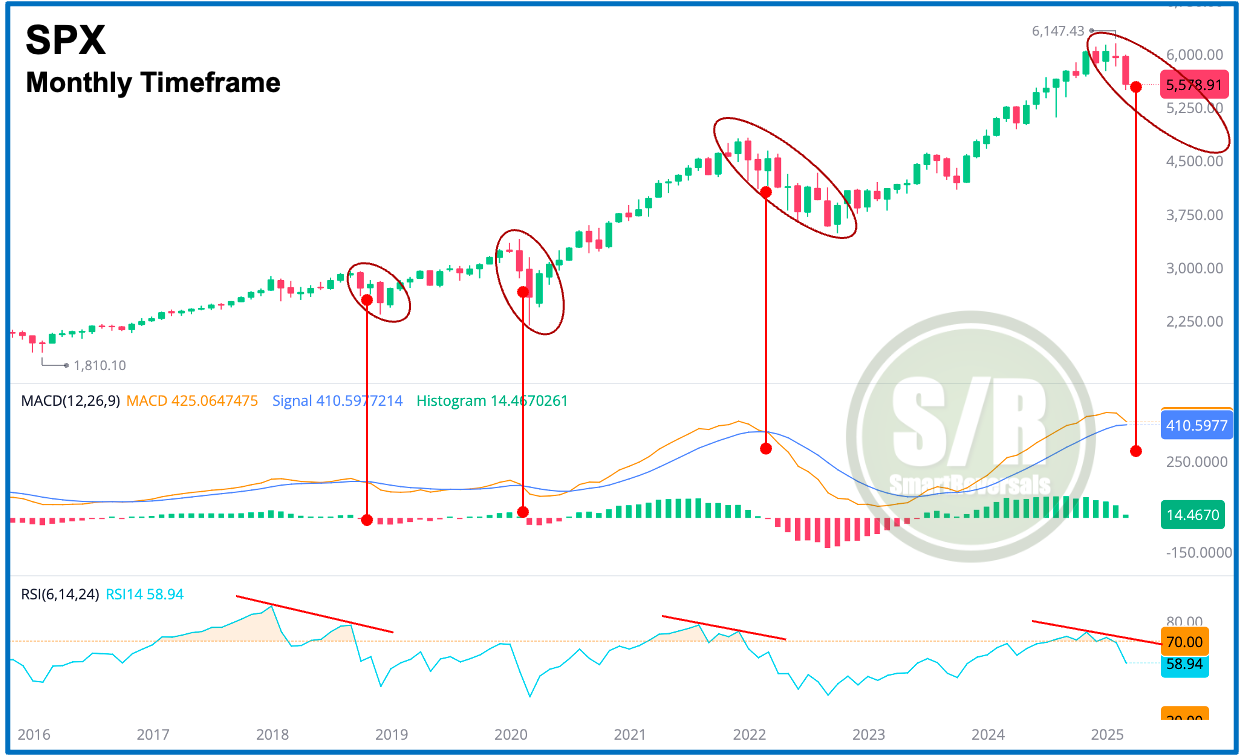
March is concluding with a monthly chart reminiscent of early bear market phases in 2018, 2020, and 2022. The bearish RSI divergence, coupled with an imminent MACD crossover, signals a likely continuation of the selloff. While Monday's trading is unlikely to significantly alter the chart, I anticipate a downtrend so a bearish continuation is expected.
Understanding that market movements are rarely a straight descent, this publication equips subscribers to navigate both the long-term landscape and short-term market swings.
The support and resistance (S/R) levels, including weekly and monthly lines, work as key reversal points and transform into support or resistance when breached. The Weekly Compass (Saturday’s publication) provides over 20 charts each weekend, featuring annual S/R levels.
These annual levels, such as the $6,100 resistance zone that initiated the current selloff and the $5,777 resistance that rejected this week's bounce, are crucial. The potential for the SPX to reach this lower resistance was highlighted in last week’s publication as follows:
The index today indicates a bullish continuation if the price maintains above $5,660.2, with an immediate target of $5,722.7. The possibility for a rapid move upcoming is likely, in that case it’s worth considering $5,777.8 as the extended bullish target. access here.
This week's high reached $5,786; 9 points above the annual line set as a target, and after finding rejection, price retraced closing at $5,580; which is exactly the annual level for the index.
Other essential levels shared last week were:
NDX: $20,245.0; and the high of the week was $20,292.2
NVDA: $122.2; and the high of the week was $122.2
AAPL: $221.4; and the high of the week was $222.0
PLTR: $97.2; and the high was $98.2
GLD: $284.5; and the high was $284,6
The weekly levels have proven their worth during one year already for paid subscribers, get access now and unlock the ones for next week.
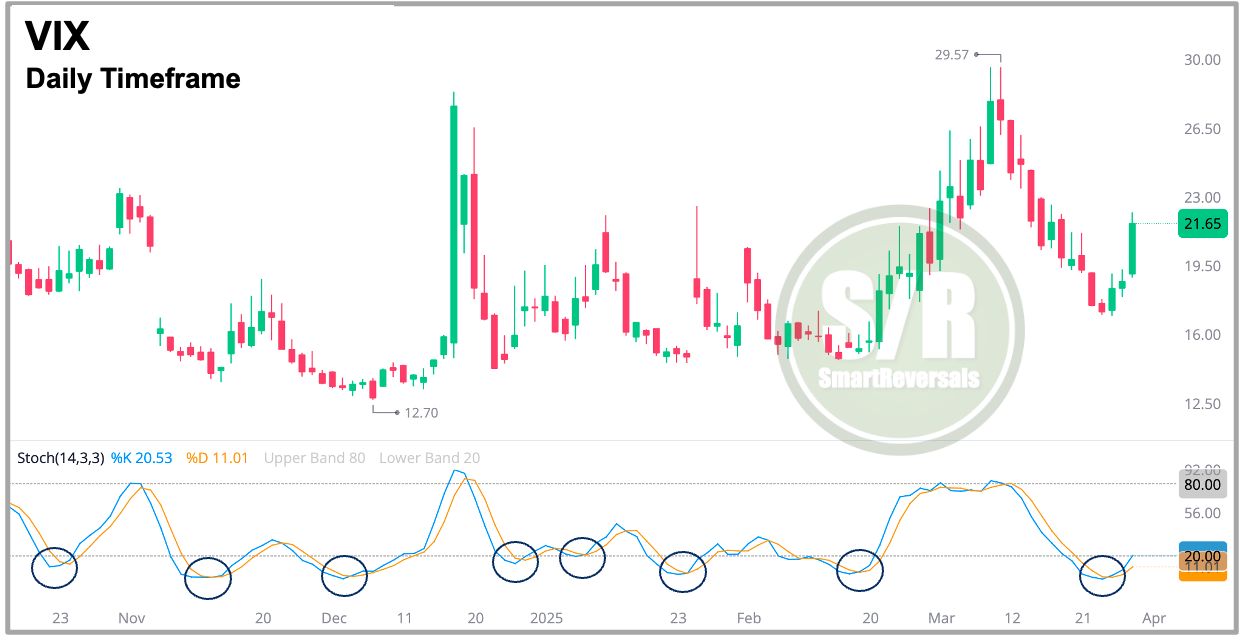
The Volatility Index (VIX) indicates that the bounce in this indicator has just began, which means that the Stock Market is likely to see bearish continuation next week even if Monday morning is green. The levels below will provide objective confirmations. Support zones are key to consider.
The Support and Resistance Levels for next week are below. If you trade any of the following securities, this publication is for you: SPX, NDX, DJI, ES=F, NQ=F, SPY, QQQ, IWM, DIA, SMH, TLT, TQQQ, SQQQ, UPRO, SPXS, UDOW, SDOW, URTY, SRTY, NVDA, META, MSFT, AMZN, GOOG, AAPL, TSLA, NFLX, COST, MSTR, PLTR, AMD, GLD, SLV, BITCOIN, ETHEREUM.
WEEKLY LEVELS for the 35 securities mentioned: