


Bounces Fade in Stocks & Crypto - Bullish Resolution Still Possible
Weekly S/R Levels for Choppy Markets - March 24 - 28

SPX successfully above $5618, the crucial weekly level outlined last Friday in this publication for this week. The chart below demonstrates the efficacy of the published weekly and monthly levels in comparison to traditional moving averages.
While this week's market choppiness may have exhausted both bullish and bearish traders, but a disciplined investor using Support and Resistance levels would have observed in a narrow price channel without directional confirmation, as the defined narrow range was consistently respected by daily candle closes.
By focusing on daily or 4-hour candle closes, the impact of short-lived volatility spikes can be mitigated. The accuracy of these levels, also the $5,502 monthly level's precise bounce, underscores their value. Investors relying solely on moving averages might have struggled with decision-making, as the chart reveals a lack of clear signals. Premium subscribers receive exclusive access to next week's key levels for SPX and 34 additional securities.
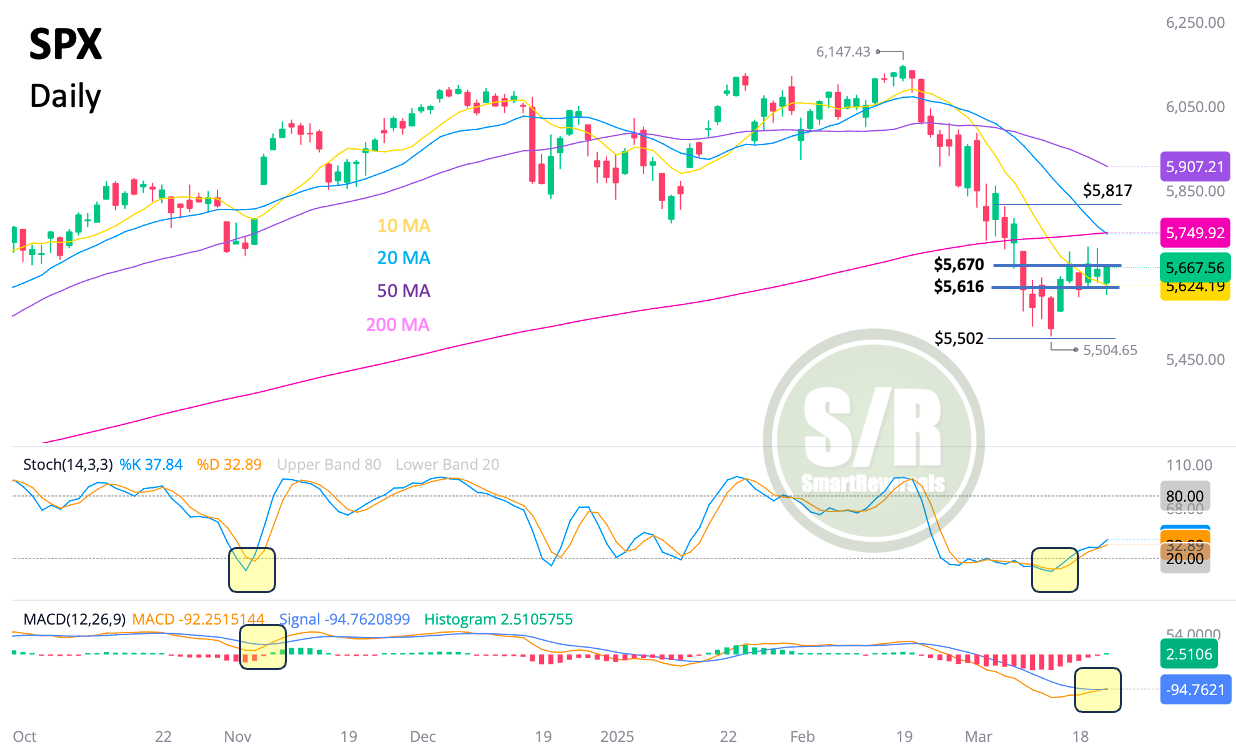
Looking at additional indicators, we observe a bullish MACD crossover, which occurred after the bullish Stochastic crossover. The most recent candle formation indicates possible bullish continuation, reminiscent of the technical setup preceding November 2024's short-term rally and consolidation phase. A similar trajectory is expected, with $5812 as a potential upside target. Anyway let’s study the levels for next week and the central one that if breached, the bounce thesis would be invalidated.
Another Point of View: The 4H Chart Since the Correction Started
Those levels include a central level among layers of support and resistances, that central or key level is charted below with a blue line, and when it is breached by a 2H or 4H candle a sell signal is triggered. The central level was the confirmation of the major top thesis one month ago.
During the recent weeks, price action has done a rapid down move and stays in specific ranges based on the S/R levels posted before price action occurs, and for 35 securities.
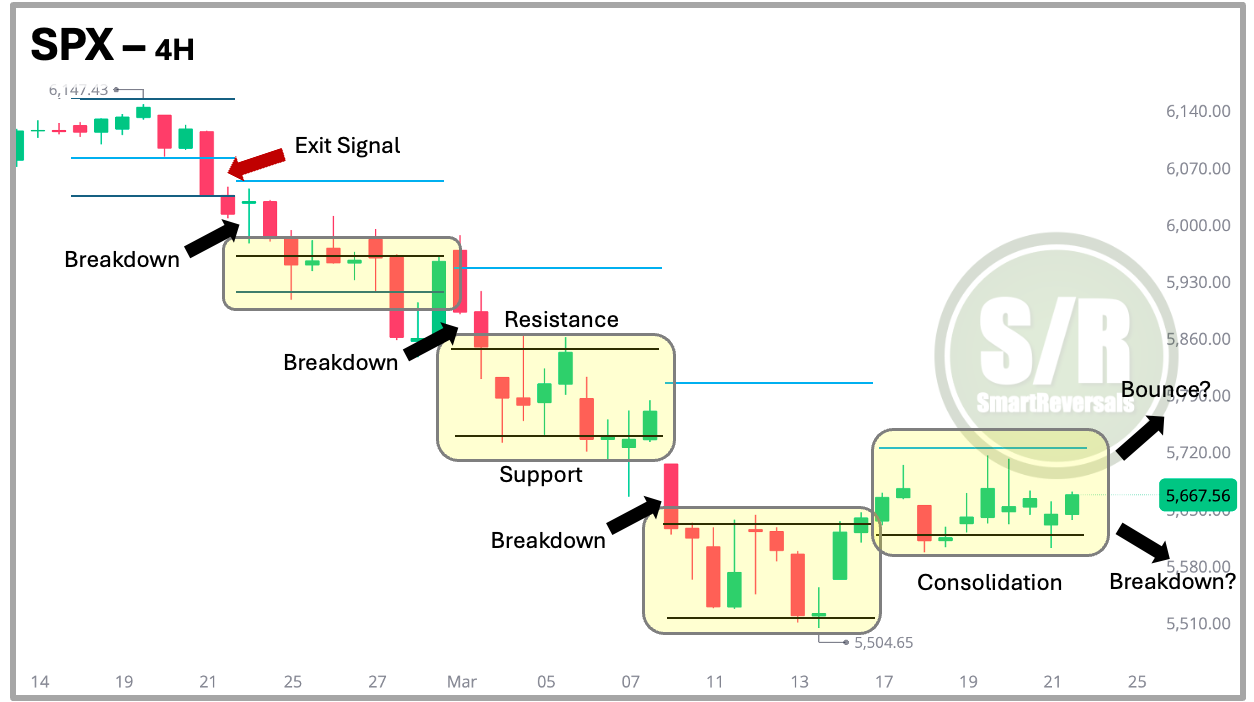
The latest price action showed signs of consolidation, the levels for next week are below, with the technical reading that suggests the direction for next week in the latest Weekly Compass: Click Here.
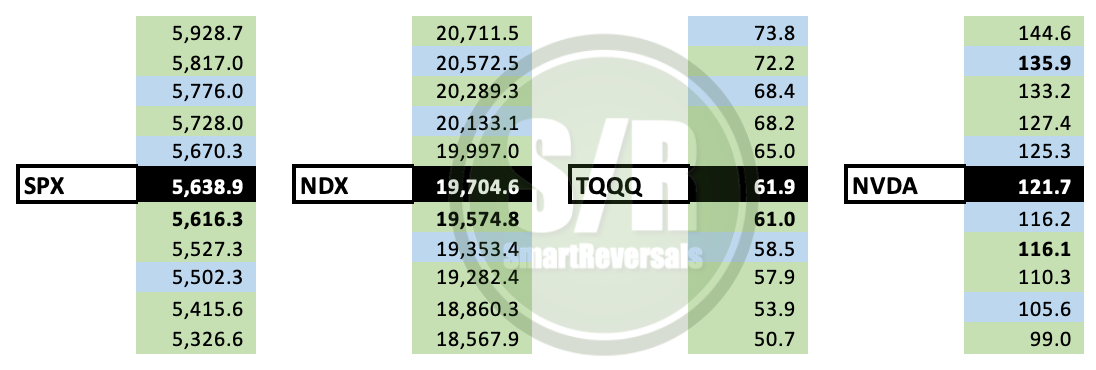
Last Friday the closing prices for SPX, NDX, TQQQ and NVDA were $5638.9, $19,704.6, $61.9, and $121.7 respectively, and the following support and resistance levels were part of the ones shared for the week that just ended. Using levels with technical indicators like the ones studied in the premium content gives you a great trading compass.
If you trade any of the following securities, this publication is for you: SPX, NDX, DJI, ES=F, NQ=F, SPY, QQQ, IWM, DIA, SMH, TLT, TQQQ, SQQQ, UPRO, SPXS, UDOW, SDOW, URTY, SRTY, NVDA, META, MSFT, AMZN, GOOG, AAPL, TSLA, NFLX, COST, MSTR, PLTR, AMD, GLD, SLV, BITCOIN, ETHEREUM.
Unlock the levels for next week and also get access to the technical studies for the U.S. Indices, all the mag 7, GLD, SLV, PLTR, MSTR, Bitcoin, TLT and more.
WEEKLY LEVELS
The central level is in the blue column as highlighted by the white arrow, the right columns indicate the equivalent variance versus today’s close: