


Bullish Engulfing Candles and Piercings Invalidated?
The Weekly Setups Printed Last Week Lacked of Follow Trough - S / R Levels for April 21st - 25th

Investing with support and resistance levels is a cornerstone of technical analysis and a vital practice for traders of all experience levels. Here's why it's so important:
1. Identifying Potential Turning Points: Support and resistance levels represent areas on a price chart where buying or selling pressure has historically been strong enough to halt and potentially reverse the current trend. Recognizing these levels helps you anticipate where price might change direction, offering strategic entry and exit points.
2. Defining Risk and Setting Stop Losses: These levels provide logical references to set stop-loss orders. If you enter a long position near a support level, a break below that level can signal that the bullish assumption was invalidated, making it a prudent place to limit potential losses. Conversely, resistance levels offer similar guidance for short positions. Why References? Because the levels can be touched and price may reverse, so setting stop losses below (for longs positions) or above (for shorts) is wise.
3. Establishing Profit Targets: Support and resistance zones can also serve as potential profit targets. If you buy near support, the next significant resistance level becomes a logical area to consider taking profits.
4. Understanding Market Sentiment and Psychology: The formation and reaction to support and resistance levels often reflect the collective psychology of market participants. A strong bounce off a support level can indicate renewed bullish sentiment, while a decisive break through resistance can signal the start of a new uptrend.
5. Improving Trade Timing: By identifying these key areas, you can improve the timing of your entries and exits, increasing the probability of successful trades and potentially maximizing profits. Entering a long position right at a confirmed support level offers a higher probability setup than entering randomly within a downtrend.
6. Providing Context to Other Indicators: Support and resistance levels can be used in conjunction with other technical indicators (as we do every weekend in the Trading Compass Edition) to create more robust trading strategies and confirm potential signals.
In essence, trading without considering support and resistance is like navigating without a map. These levels provide crucial context, help manage risk, and improve the overall effectiveness of your trading decisions. By understanding and utilizing these fundamental concepts, you can trade with greater confidence and increase your chances of success in the market.
This publication provides 7 layers of Support and Resistance levels for 35 securities; highlighting the central one as the reference to have bullish expectations (ir price is above) or bearish ones (if price breaks or stays below it).
During the week that just ended, the expected bounce started on Monday AM, however, with a gap up, which in volatile markets like this one is risky considering the chances of a rapid fill, which happened during that same day.
The SPX managed to stay above its central level, actually $5,226 was the precise level from where the price bounced on Wednesday, as $521 for SPY, $182.7 for IWM, $441.5 for QQQ, and $18,155 for NDX. Tech provided an example of levels momentarily breached.
The news about NVDA, and the current uncertainty affected the setup, and as mentioned last week, the levels help to set ranges in times when prices are presenting rapid swings.
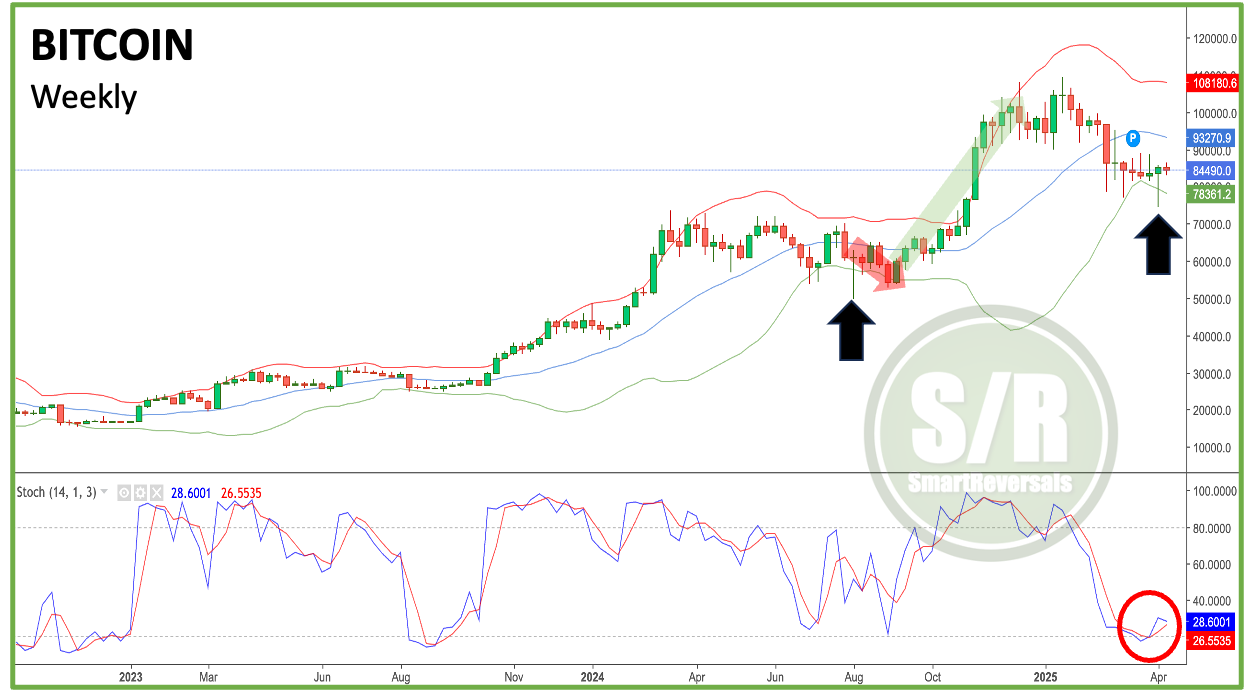
Two securities presented notable resilience, PLTR and Bitcoin; both managing to stay above their central levels:
BITCOIN:
The bounce thesis is still on for this security considering the support provided by $81.7K, some choppy price action is expected, but considering oversold oscillators, a scenario like August/September can be expected.
Is the Corrective Bounce Invalidated?
The bear market rally or corrected bounce expected didn’t have follow trough, the global trade context doesn’t stop bringing more negative news than positive ones, the setups for the indices and stocks look again weak, and that will be assessed in the technical zoom in for 20+ charts. In the meantime it’s worth noting that an uncommon bullish signal was printed in the market last week, and even with a small sample of events, the 100% probability of positive outcomes after 3 months suggest that the bottom in terms of time at least is near.
For access to the charts and analysis of that bullish event, with the historical follow through analyzed with charts and indicators click here. The current market doesn’t look different to two previous occurrences.
Another element to watch carefully is the setup brought by the VIX, let’s study it.
Before continuing, the Support and Resistance Levels are updated every week for 35 securities including: SPX, NDX, DJI, ES=F, NQ=F, SPY, QQQ, IWM, DIA, SMH, TLT, TQQQ, SQQQ, UPRO, SPXS, UDOW, SDOW, URTY, SRTY, NVDA, META, MSFT, AMZN, GOOG, AAPL, TSLA, NFLX, COST, MSTR, PLTR, AMD, GLD, SLV, BITCOIN, ETHEREUM. If you trade some of those securities, this publication is for you.
VIX Breaching This Level Could Reignite the Bounce: