Is Friday Bounce Sustainable? The Levels Have the Answer
They offer key insights into potential price reversals or consolidations, helping to identify entry and exit points.
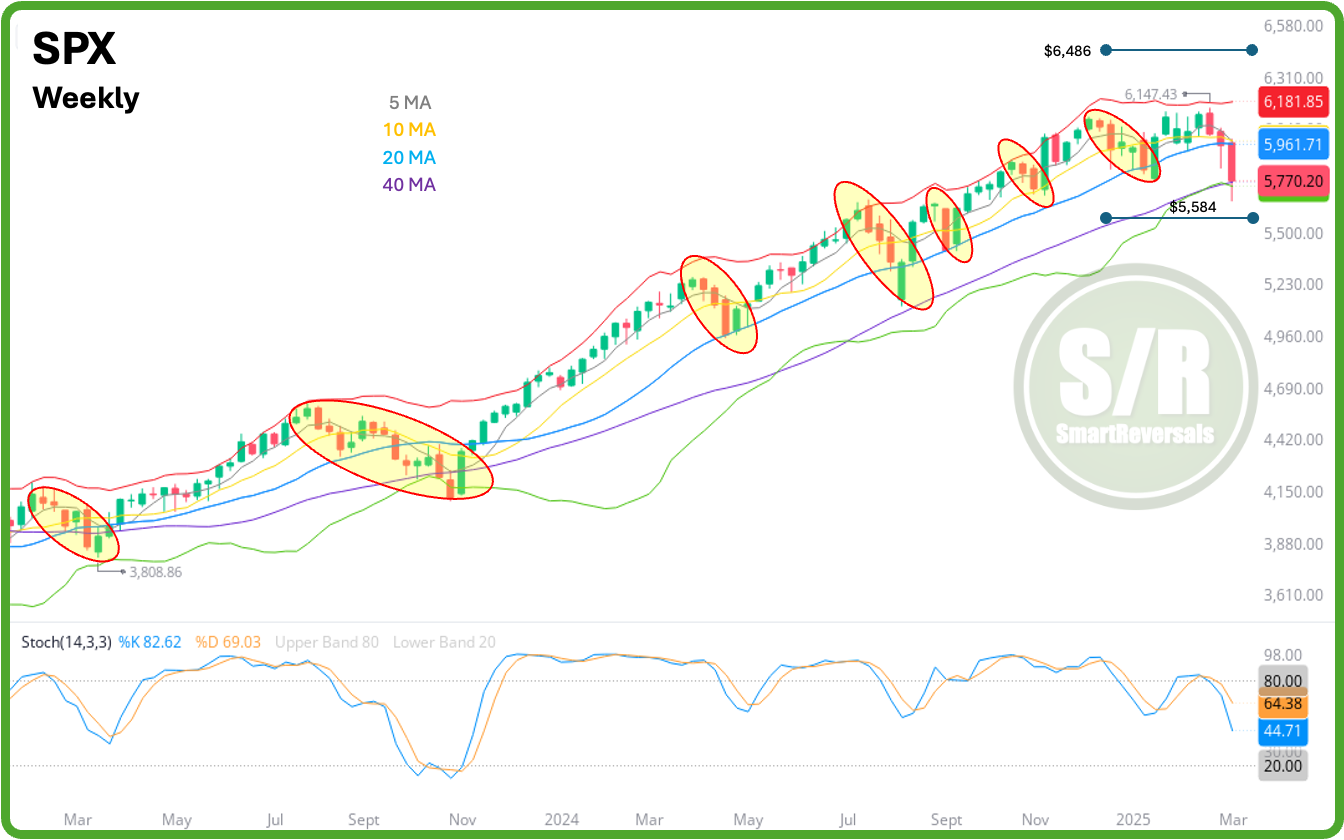
The SPX has now recorded its fourth consecutive red week, with price action aligning with last week's charts, which showed a bearish candle resting on the 40-week moving average (MA) but lacking additional bounce indicators.
Support and resistance (S/R) levels, including weekly and monthly lines, serve as key reversal points and transform into support or resistance when breached. Notably, the Weekly Compass provides over 20 charts each weekend, featuring annual S/R levels.
These annual levels, such as the $6100 resistance zone that initiated the current selloff and the $5884 support that prompted this week's bounce, are crucial. The potential for the SPX to reach this lower support was highlighted last week.as follows:
If price remains below $5,807.5, the next targets are $5,628.9 or a retest of the $5,670 monthly level with a short term worst case visiting the annual $5,584 level. The chart posted last week was the following. For the complete publication get access here.
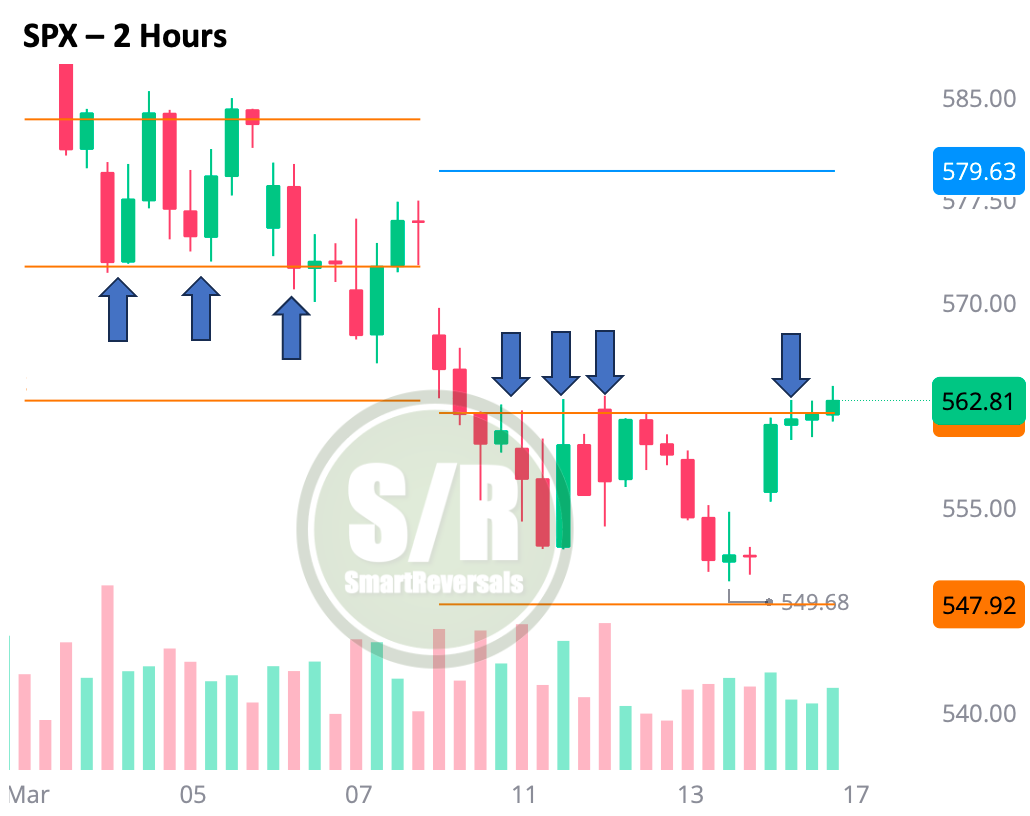
This week's low reached $5,504, 80 points below the annual line, but within the weekly support zone of $5,487, identified last Friday. Simultaneously, $5,628 acted as resistance throughout the week, only to be surpassed on Friday afternoon.
These pre-shared levels have proven essential, as price action consistently moves between them, aiding in anticipating reversals and validating consolidations. The chart below illustrates these pre-shared levels and the corresponding price action.
The weekly levels have proven their worth during one year already for paid subscribers, get access now and unlock the ones for next week.
If you trade any of the following securities, this publication is for you: SPX, NDX, DJI, ES=F, NQ=F, SPY, QQQ, IWM, DIA, SMH, TLT, TQQQ, SQQQ, UPRO, SPXS, UDOW, SDOW, URTY, SRTY, NVDA, META, MSFT, AMZN, GOOG, AAPL, TSLA, NFLX, COST, MSTR, PLTR, AMD, GLD, SLV, BITCOIN, ETHEREUM.
WEEKLY LEVELS for the 35 securities mentioned:
See the black arrow, it highlights where the price closed relative to the central level for next week, the red percentages indicate the securities that have to raise at very least that percentage to switch momentum to a potential bullish reversal, for example AAPL has to recover $219 or jump 2.7%. NVDA, TSLA and PLTR closed already above their central levels for next week (see the analysis below). The blue column shows the levels that act as support for the bullish thesis and they work as a reference for risk management (stop losses).
The monthly table highlights the price levels where significant resistance is expected for SPY, QQQ, IWM, SMH, ES=F, NQ=F, and DIA.


