


Is This the Turn? SPX's First Notable Bounce in 8 Weeks
Support and Resistance Levels for the Week of April 14th to 18th


After the VIX spiked to 60, U.S. indices showed a positive week, but be aware that intra-week volatility has been extreme, exhausting both bulls and bears, triggering stop losses on both sides. Price action has been erratic, leading to short-term invalidation of setups, yet remaining consistent with the Support and Resistance Levels.
The previous publication presented how violent can be the bounces during bear markets, providing visual guidance on how technical analysis can be used in your favor to be profitable in bear markets as well and not even shorting (if so, the potential is higher, but with the right preparation, mindset and use of S/R levels. The publication studies the technicals of six bear markets (1987, 2000, 2008, 2018, 2020, and 2022); with the key level to watch for rejections, which is the same level that once conquered, the bottom is in. Get access to this must read and bookmark publication:
Click here: A Study of Bounces Across Six Major Market Corrections
Last weekend, I developed a graphic model outlining potential price action scenarios for this week, guided by the color key on the left. Price action moved with notable precision within these scenarios, finding weekly support around $4,864, consolidating near $5,729, and experiencing a significant rejection very close to $5,489 on Wednesday.
The purpose of these levels is to identify zones where price action might reverse or consolidate, making them a valuable tool for investors and traders to anticipate potential rejection points. Price movements can be projected using technical indicators, and based on the Volatility Index and Bollinger Bands, the charted scenarios both pointed towards $4,654. However, the annual level of $5,068 provided crucial support.
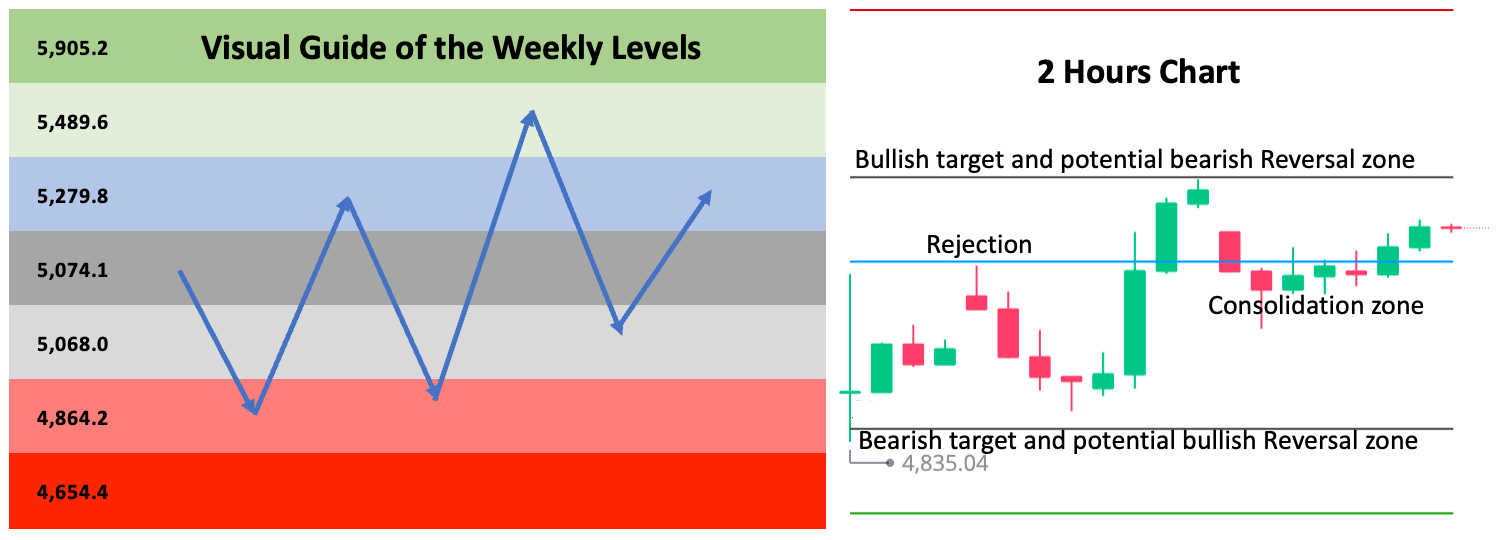
The week concluded by fulfilling both the bearish and bullish scenarios, with price bouncing at the $4,864 zone, later finding rejection at $5,489 and subsequently moving down again to the $4,864 zone. However, the anticipated 8% rally materialized in a single, powerful daily surge of +9.5% before price faced rejection once more.
The Support and Resistance Levels are updated every week for 35 securities including: SPX, NDX, DJI, ES=F, NQ=F, SPY, QQQ, IWM, DIA, SMH, TLT, TQQQ, SQQQ, UPRO, SPXS, UDOW, SDOW, URTY, SRTY, NVDA, META, MSFT, AMZN, GOOG, AAPL, TSLA, NFLX, COST, MSTR, PLTR, AMD, GLD, SLV, BITCOIN, ETHEREUM. If you trade some of those securities, this publication is for you.
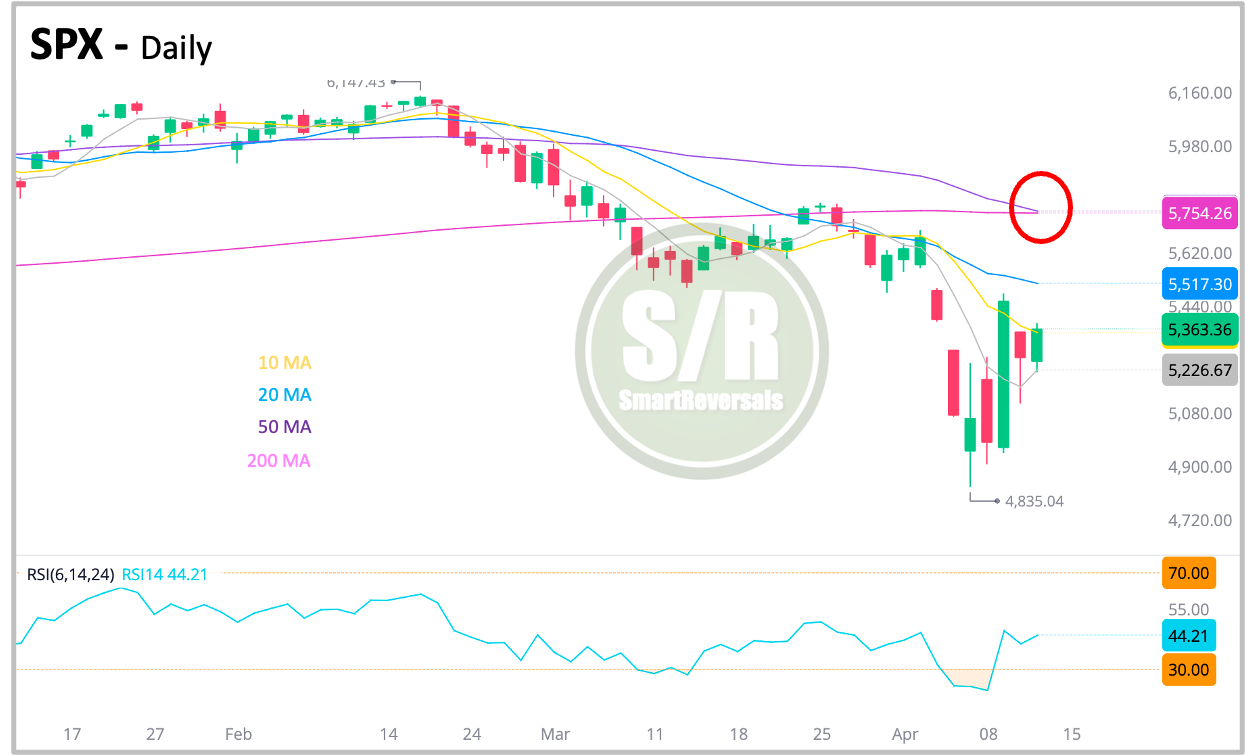
Death Cross Imminent in SPX
That signal, the 50-day moving average crossing below the 200-day moving average, was the subject of an educational analysis covering the last decade, published just two weeks ago. Review that publication to see for yourself the signal's historical relevance for SPX, NDX, IWM. AAPL, NVDA, DAX, and FXI; back then I anticipated that the international indices were about to crack, and that happened. For access to the publication, click here.
The Support and Reversal levels help to validate moves in a bear market, since moves are violent and based on high frequency trading algorithms. The ones for the following week are here:
WEEKLY S/R LEVELS: