Lower Lows Across the Board
The week was a rollercoaster ride, with economic uncertainties - Withe House & FED statements are influencing market behavior.
The bearish continuation forecast published last week proved accurate -access here-. While a bounce occurred on Friday, February 28th, strict price action analysis revealed unconvincing signals. Consequently, I noted that 'the structure suggests that a bounce could be short-lived,' which indeed transpired, with the bounce lasting only one hour on Monday.
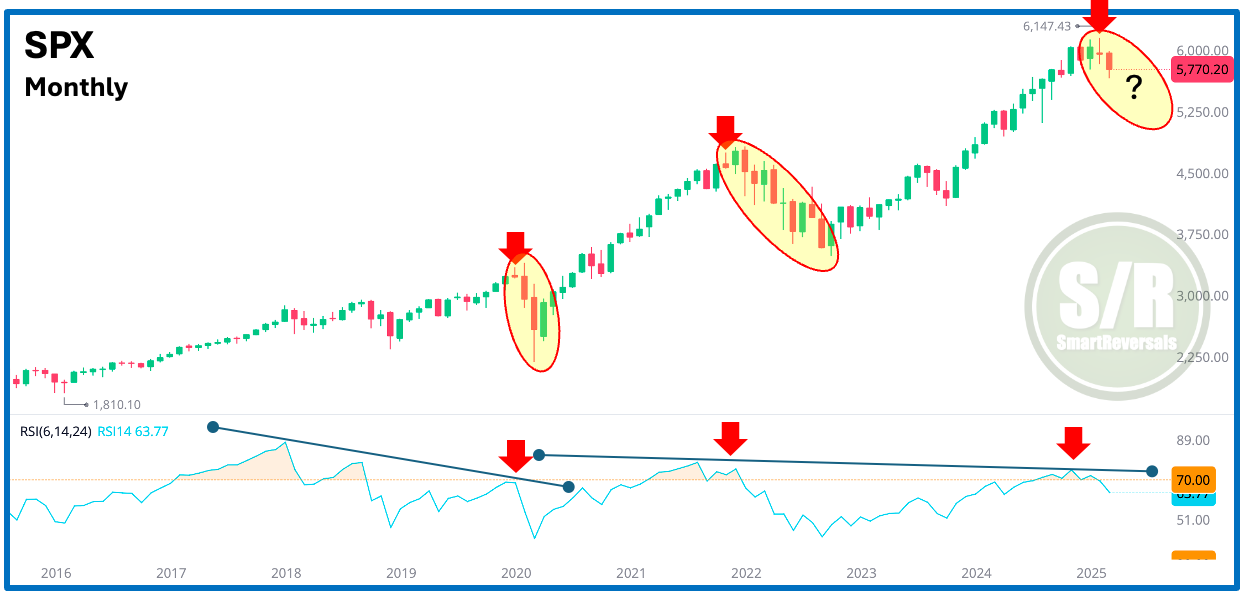
Over the past month, this monthly chart has been meticulously monitored within our premium subscriber content, as it displayed critical warning signs that preceded the two previous major declines: a monthly shooting star candle accompanied by an overbought RSI and a bearish divergence (lower RSI highs coinciding with higher price highs.
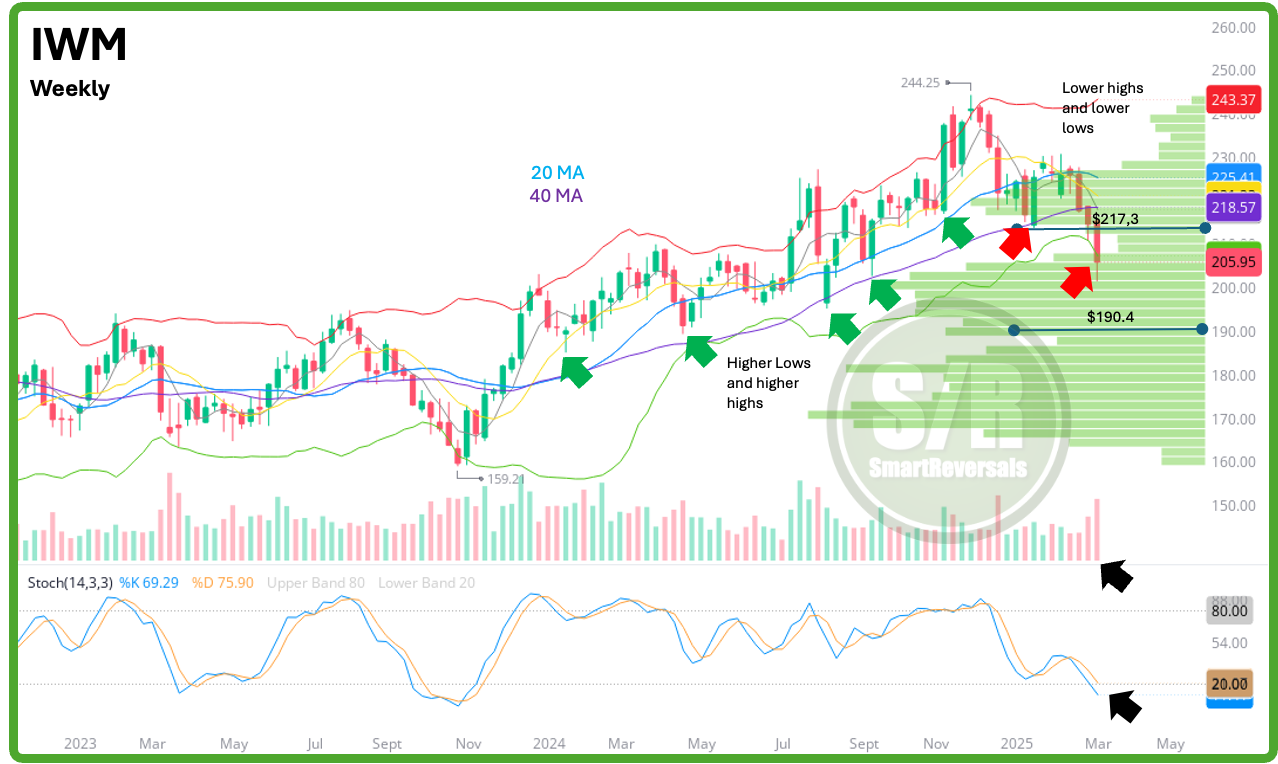
Thus far, March has seen an immediate decline following February's bearish signal. This rapid descent has significantly weakened the technical structure across shorter timeframes, such as the daily and weekly charts. The 200-day moving average is now under threat, and a clear series of lower lows is evident, particularly on the weekly chart presented below.
Last but not least, the macro publication posted two weeks ago -access here- highlighted how leading macro indicators are anticipating an economic downturn, and yesterday’s jobs/ADP reports continues building on the thesis, which is based on solid and backtested indicators, this is not a personal opinion, the macro publication is clear.
For investors looking forward for rate cuts, FED Chair Jerome Powell said on Friday in a speech for the U.S. Monetary Policy Forum that the central bank can wait to see how the White House’s policy actions play out before it moves again on interest rates.
“The White House is in the process of implementing significant policy changes in four distinct areas: trade, immigration, fiscal policy, and regulation,”. “It is the net effect of these policy changes that will matter for the economy and for the path of monetary policy.”
The current context suggests caution not only for swing traders or scalpers, but for long term investors as well.
IWM: Last week, this publication anticipated a bearish continuation if price continued below $214.8, that bearish expectation was a combination of technical analysis and Support and Resistance Levels published every Friday for 35 securities setting the range for the week ahead -For March 10th to 14th edition access here-
The chart below shows oversold conditions relative to Bollinger bands and oscillator, but any bounce would have a lot of hurdles to overcome: Green arrows illustrate a sequence of higher highs, while red arrows indicate a shift in character. Last week's breach of the previous volume shelf triggered a rapid descent to the lower shelf, accompanied by a bearish candle suggesting either continuation or indecision for the coming week.
The break below the annual $217 level marks another bearish milestone, establishing it as strong resistance. Maintaining price below $207.9 supports the bearish continuation case, with a potential target of $199.8. Conversely, the daily chart shows indecision candles following Monday's sharp decline between volume shelves. Should a bounce occur and $207.9 be reclaimed (a possibility given oversold oscillators), the next level to monitor for a potential lower high is $214.
The same in-depth analysis describing the current setups, with price targets and key annual support and resistance levels continues for SPX, DXY, GLD, SLV, TLT, NDX, SMH, MSTR, PLTR, GOOG, AAPL, NVDA, META, MSFT, AMZN, and BTC; with volatility and breadth indicators analyzed. If you actively invest or trade any of these securities, this publication is essential for making informed investment decisions.
Lat week, the charts open for everyone were SMH and TSLA, both presented bearish setups that were confirmed, the updated analyses are below.
It’s worth noting, that IWM, SMH, MSTR, MSFT, TSLA, and GOOG have breached key annual levels posted in January; during 2023 and 2024 the annual levels were conquered, not lost. NDX, NVDA, AMZN are on the edge of losing the annual support while META and PLTR lost what was built until February. Let’s begin:
SPX: Key Moving Average Tested - One More Important than 200 DMA


