


Make or Break - 3 Indicators to Monitor Next Week
Excessive Pessimism in the Stock Market can be Bullish, but the Price for U.S. Indices is not yet Oversold

Monday brought the expected bounce; however, the gap-up seen during such uncertainty suggested a prompt fill, which indeed happened later that same day.
Today, significant pessimism pervades the stock market. This analysis will balance this sentiment with price action, given that excessive negative sentiment has often preceded rallies in recent years, including during the 2022 bear market.
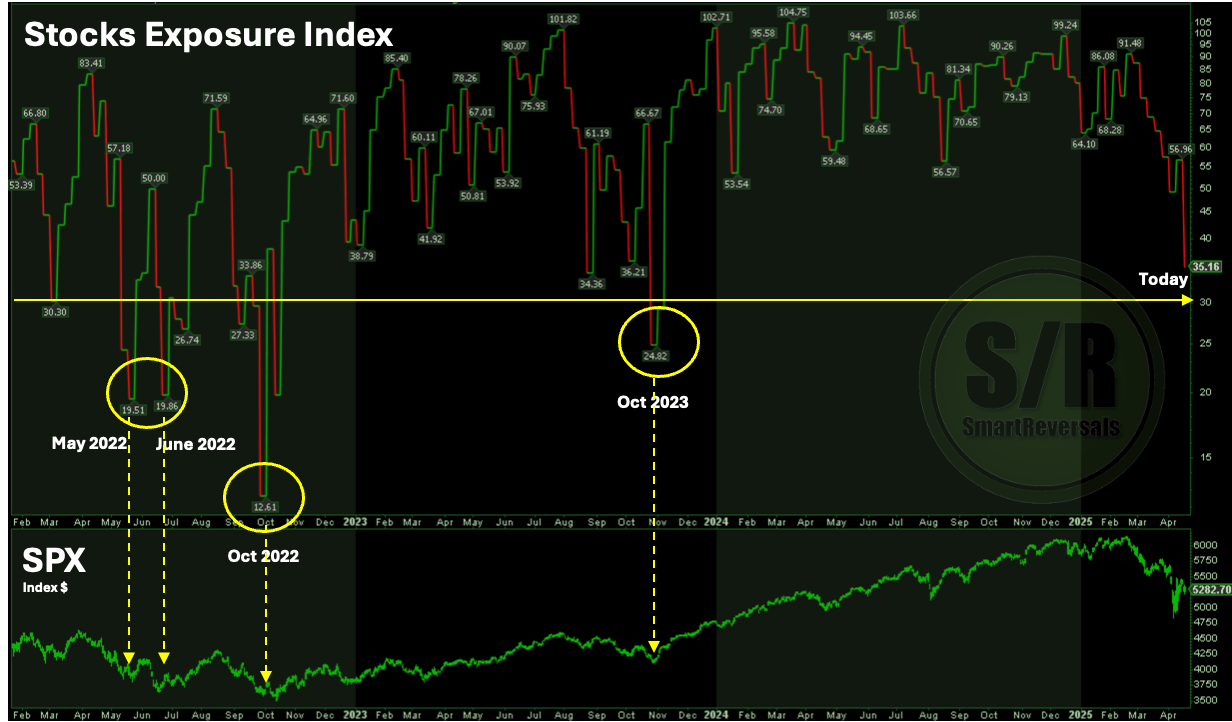
Let's examine the average stock exposure reported by the National Association of Active Investment Managers. As shown in the chart below, which starts from 2022, allocations below 30% have historically preceded bear market rallies. For instance, a 6.5% short-lived rally occurred in May 2022, a multi-week 19% rally began in mid-June 2022, and the low allocations in October 2022 and 2023 coincided with market bottoms.
The good news for bulls is that such low allocations have been signals for bounces. Currently, the index is low, but not yet below the 30% threshold seen during those previous turning points.
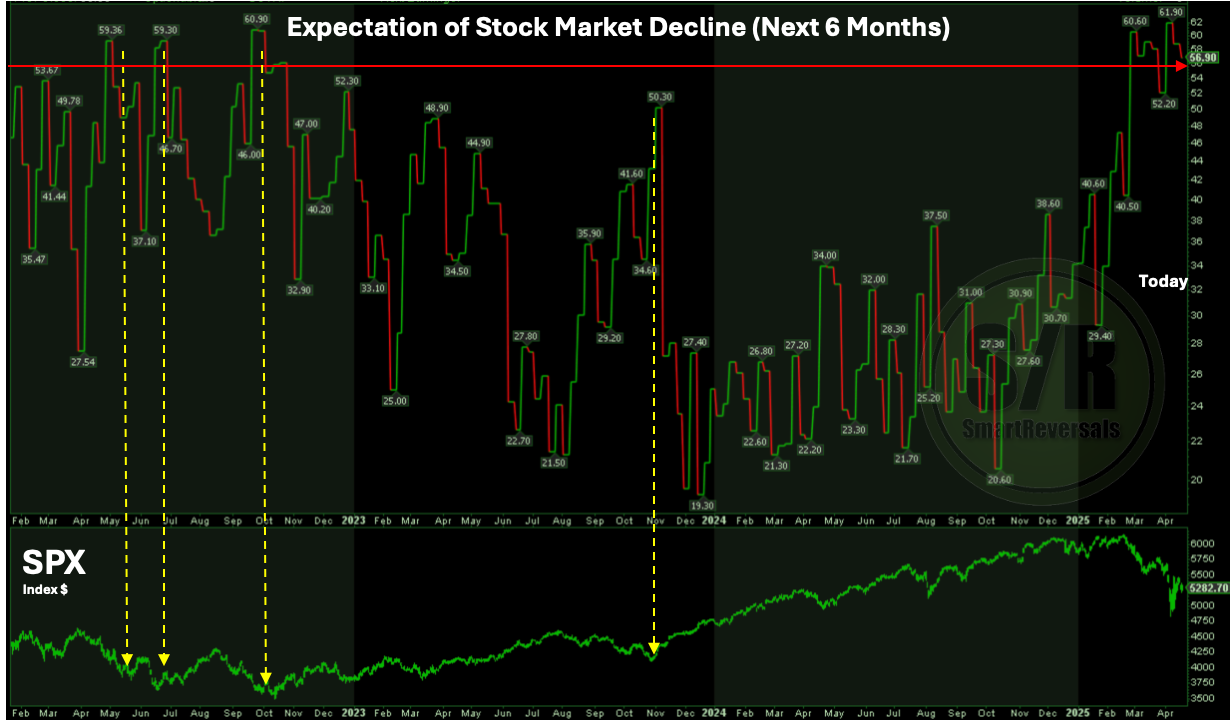
Examining the expectation for a decline over the next six months, the current pessimism is remarkable and comparable to the past events we've discussed. As the dotted arrows on the chart illustrate, periods where pessimism exceeded 55% have historically coincided with significant bottoms for the S&P 500.
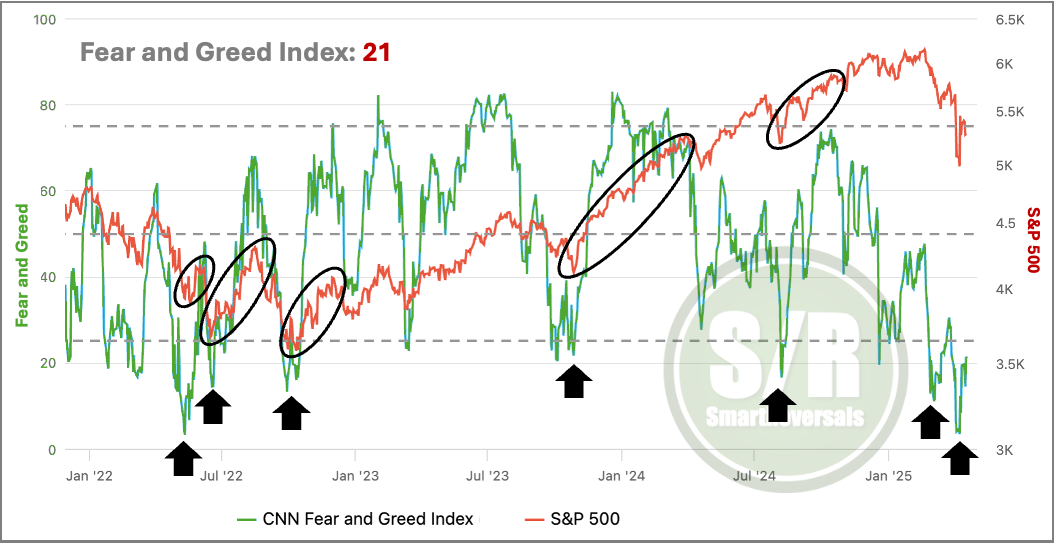
Adding to this sentiment picture, the Fear and Greed index is also currently at an 'extreme fear' level. While it hasn't hit its most recent low of 4, this reading still indicates significantly negative sentiment towards the S&P 500. The chart below highlights the same historical events we discussed earlier, and also includes other periods of extreme index lows, such as in August 2024 during the Carry trade selloff, and recent lows in 2025 that preceded minor bounces.
Based on the three charts presented, conditions appear aligned for a bounce. However, price action is a crucial factor to consider. The bottoms mentioned for 2022, 2023, and 2024 (if including the carry trade selloff) all occurred when price was oversold. In contrast, the bounce this past week has been weak and lacked conviction. Next week will be decisive for the stock market considering two aspects:
Bearish sentiment flag that a bounce can be nearby, but not the exact bottom (see in the first two charts, the bottoms in May and June 2022 were days away from the sentiment reading).
Price action lacked conviction for a bounce last week (the long weekend could have affected, but the charts don’t differentiate events).
On the other hand, the previous publication studied a rare bullish event that happened two weeks ago for the 7th time in decades, the study concluded that 5 out of the 6 previous occurrences the bottom was in, and in one of them more pain was ahead and the bottom happened days after. The comprehensive study with charts and technical comparisons with 2025 is available, click here.
This publication uses the volume profile in several charts: DJI, NDX, TLT, SLV, MSTR, PLTR, GOOG, AAPL, TSLA, NVDA, and many more, for educational content about this indicator, click here. And for access to the complete library, click here.
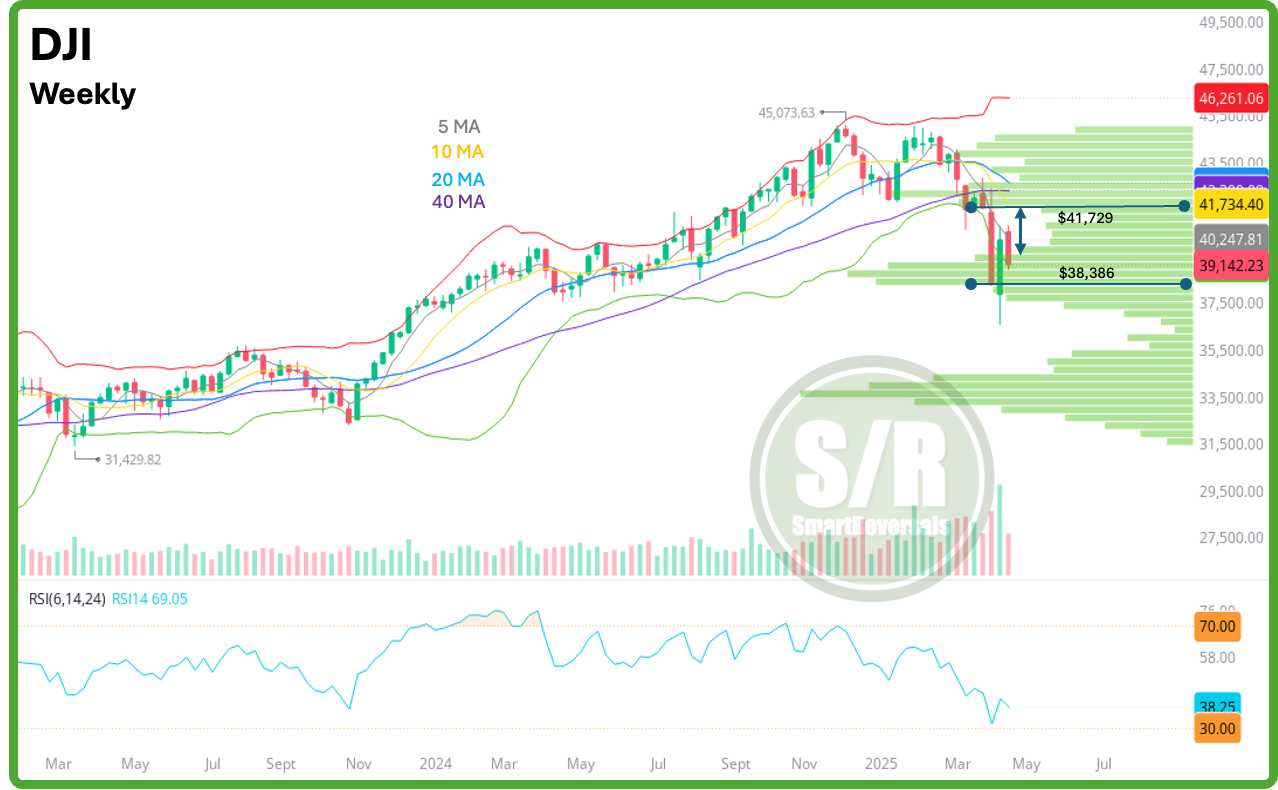
Regarding price action, let's start with the Dow Jones Chart:
DJI: Last week's setup appeared ready for a bounce. The annual $38.3K level held well as support, and the green candle initially suggested continuation or, at the very least, indecision (like a doji candle we've seen). However, today's conviction in the red candle completely changes the landscape. This reflects a clear rejection from the monthly $40.4K level, coinciding with resistance from the weekly 5-period moving average.
The volume gap, highlighted by the double arrow, further supports the thesis of rapid moves between these key price levels ('shelves'). Additionally, the RSI is falling once more.
Based on this price action, the Dow Jones is suggesting potential downside next week. As long as it continues trading below $39,628, the stage is set for a decline towards $38,464 before the potential bounce suggested by the pessimism presented above. Conversely, regaining the $39.6K level could open the door to a bullish target at $40,305.
Let’s go back to the S&P 500 and the same in-depth technical chart and analysis describing the current setups, with price targets and key support and resistance levels. This publication also continues for: VIX, DXY, NDX, IWM, PLTR, GLD, SLV, TLT, MSTR, GOOG, AAPL, NVDA, META, MSFT, AMZN, and BTC; with volatility and breadth indicators analyzed. If you actively invest or trade any of these securities, this publication is essential for making informed investment decisions.
The weekly S/R levels for those securities and many others including NFLX, AMD, COST, TQQQ, SQQQ, ETH, SPXS, UPRO, UDOW, SDOW, URTY, and SRTY are available, click here.
Upgrade your subscription to paid/premium today and lock in your current price. Effective in May, the monthly subscription rate will increase to $49, all current paid subscribers (monthly or annual) will keep their existing rate. Exciting new features like audio and video are also coming soon. Secure your price now! (If you’re currently a paid subscriber, you do not have to do anything, your plan continues business as usual).
SPX Outlook: Balancing Bullish & Bearish Forces with 3 Key Indicators
The Dow Jones was significantly affected by UNH, and the outlook is bearish, for SPX and NDX there is one difference in the chart that is worth considering: