


Multi-Week Bounce Starting? 3 Indicators to Monitor
Piercing and Bullish Engulfing Candles Across the Board - The VIX is Still Overheated

This past week was likely one of the most volatile many investors will ever witness. If you navigated it, take pride in that, because intense periods like these offer unparalleled learning opportunities across several crucial aspects:
Recognizing Euphoria and Trusting Technical Warnings: Next time, you'll be more inclined to act on sell signals despite optimistic market noise suggesting imminent new highs. You'll remember the technical warnings, such as the ones I highlighted as early as December, and the subsequent confirmations in February, even when the initial market declines were minimal.
The Indispensable Role of Stop Losses: You'll appreciate the critical importance of setting stop losses. These automated orders remove the emotional burden of making difficult sell decisions during turbulent times, protecting your capital. This is precisely why I provide multiple levels, including a central one that serves as crucial insurance against both bearish and bullish reversals (if you're in a short position).
Avoiding Capitulation at Oversold Extremes: You'll learn the danger of capitulating when technical indicators reach extreme oversold levels. Often, these points precede significant bounces, and selling at the absolute bottom locks in losses unnecessarily.
Questioning Broad Statistics: You'll be more discerning about relying on general statistics, such as the often-cited "SPX is higher one year later 70% or 80% of the time." You'll understand the crucial point: the SPX tends to be positive in approximately 80% of years anyway, so a statistic below 90% doesn't offer a significant edge or capture the nuances of bear market recoveries.
Enhanced Emotional Awareness: You'll have a deeper understanding of your own emotional responses and how to manage them during turbulent market conditions.
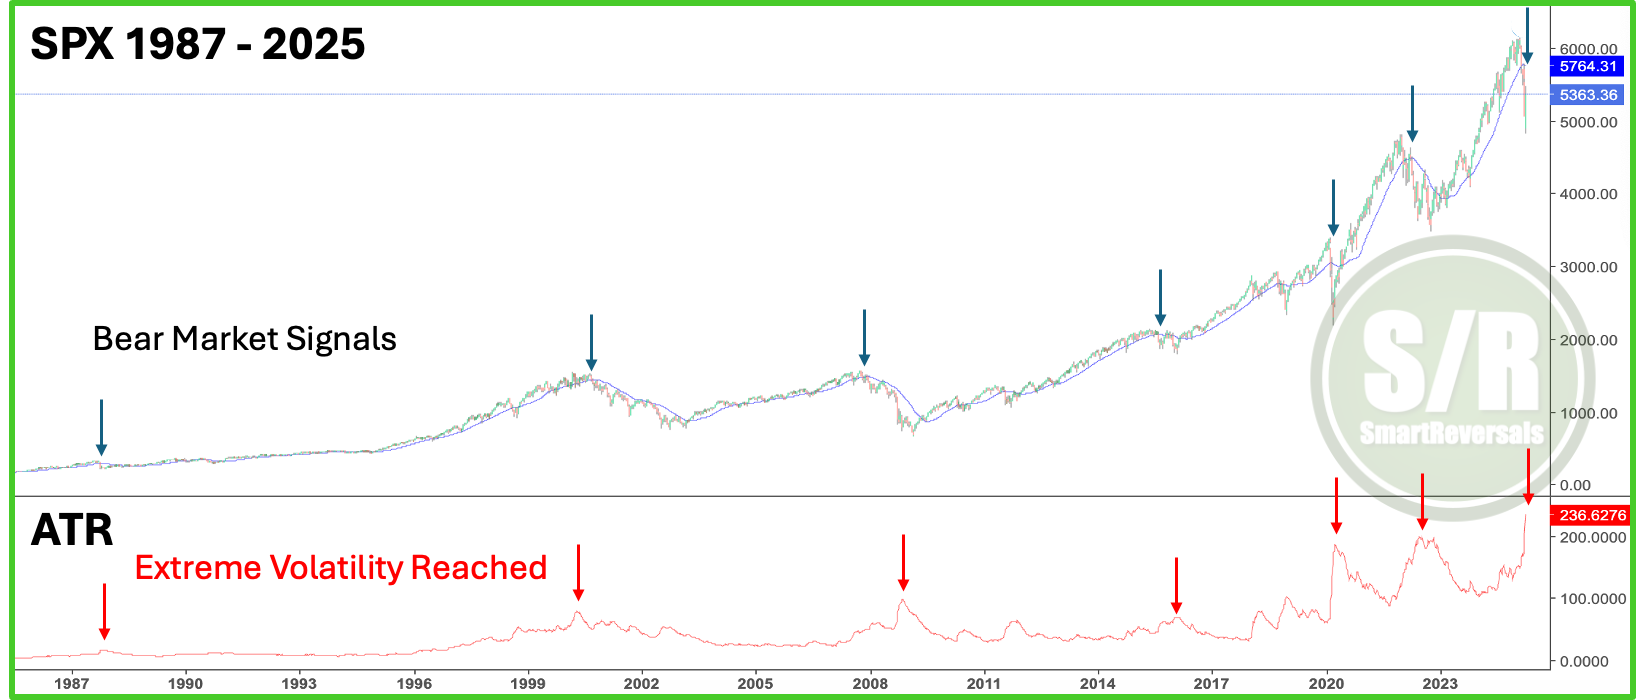
So, what made this past week truly unique? Let's examine two key indicators. First, the VIX, or volatility index, surged to 60, reaching extremely overbought conditions and remaining there. To provide context, during the 2022 bear market, the VIX peaked at a significantly lower 39, and in 2018, it reached 50. Even during the 2000 dot-com crash, the VIX did not exceed 50 between 2000 and 2002. While higher VIX levels are possible, as seen in 2008 (89) and 2020 (85), disciplined technical analysis suggests a temporary peak is now in place.
Today, you possess significantly more knowledge, perhaps gained through a challenging experience. However, this knowledge is invaluable and permanent. If you are among the persistent investors and traders who choose to continue, you will undoubtedly become more skilled with each experience. The insights I share in this publication were not learned in stable years like 2016, 2017, 2019, 2021, or 2024; they were forged during bear markets when the necessity to study more intensely became clear. It was thanks to the lessons of 2018, 2020, and 2022 that SmartReversals exists today.
The second indicator that made this week unique is the Average True Range, which is a technical analysis indicator that measures market volatility. Unlike indicators that show price direction, the ATR solely reflects the degree of price fluctuation over a specific period. A high ATR value indicates high volatility, meaning prices are moving significantly up or down. Conversely, a low ATR value suggests low volatility, with prices trading within a tighter range.
My publications have highlighted the importance of some specific trendlines, the major trigger for 2025 and it was by mid march when the 40 weekly average was lost, today the ATR reached an all time highs that suggests that most of the decline in the short term is in.
This does not mean that the bottom is in, this means that most of the bearish move is in, and the content below analyzes the key indicators and levels to navigate next week.
The analysis continues below, with the semiconductors sector (SMH), Tesla (TSLA), and then key considerations for the SPX and over 20 other charts for with price targets.
Over the past week, the following publications have analyzed price action during historical bear markets. Given their very long-term perspective, their insights remain relevant over time, offering a depth of knowledge that surpasses most books and alone justifies the subscription. Use the links for access:
Navigating the Market's Tides: The Power of Elliott Wave Analysis
Navigating Market Crossroads: A Technical Study of Historical Corrections
Bearish Crossover and Divergence Analysis: Market-Wide Implications
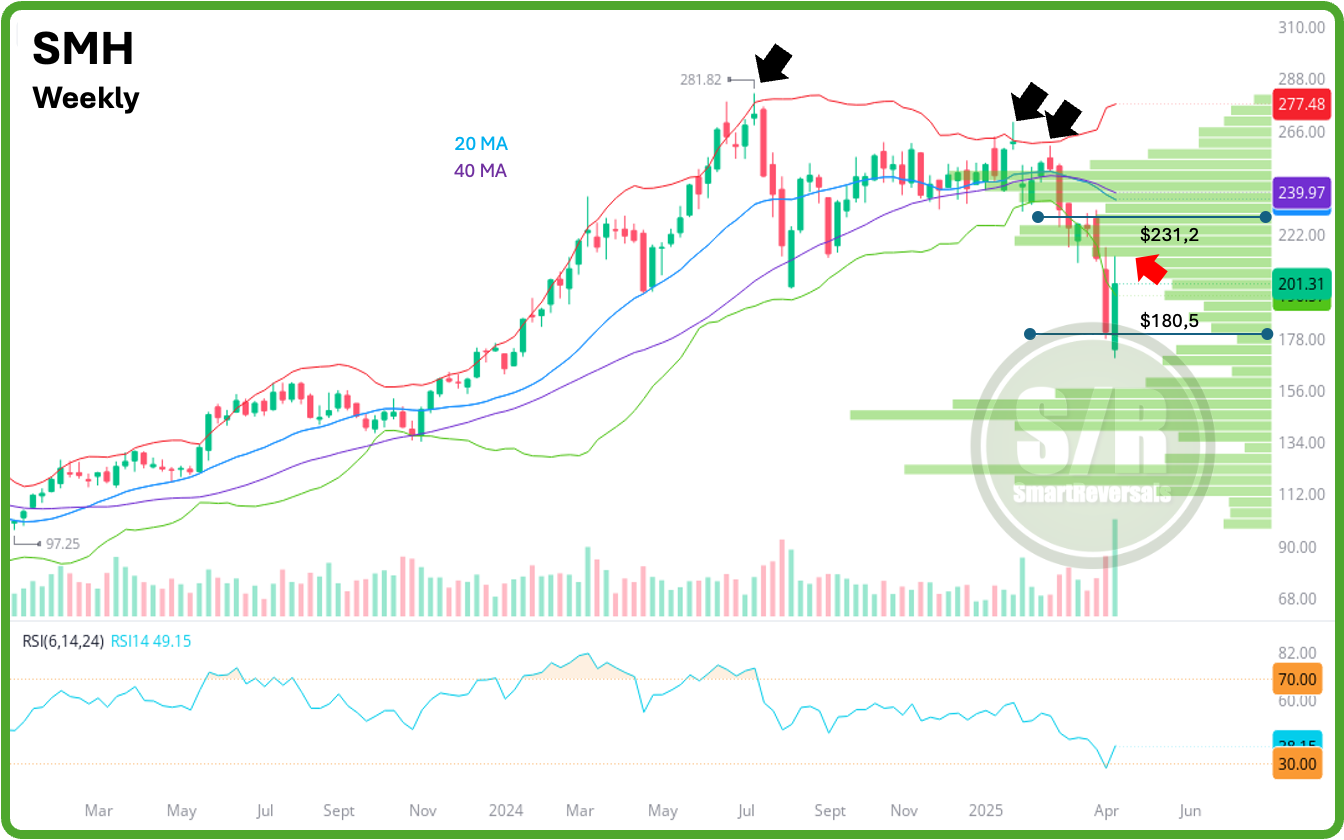
SMH: Zooming in on the shorter timeframe, let's check out what's happening with the semiconductor sector, using this ETF as a reference since AI was the big driver of the bull market that ended in February, so it's definitely worth studying the semiconductor chart.
The black arrows point out stuff that, after the recent sell-off, you'll want to pay more attention to – those shooting star candles crossing the Bollinger Band, which have been a major heads-up for reversals as highlighted in this publication with accuracy.
Another indicator we've been looking at with premium subscribers lately is the volume profile, and that's proven to be a must-watch, especially when price hits the edge of those volume shelves. There's always a gap between the shelves, and they act like demand or supply areas, so when you lose one, like what happened two weeks ago, the move can be very fast, as you can see with that red candle.
Last week, we also mentioned how the annual $180 level could be a potential support, and since the price was pretty oversold compared to the Bollinger bands, that support acted like a bouncer. Right now, we can see that the lower edge of the upper volume shelf acted as resistance (that's the red arrow), so $209 is very likely to be reached this coming week (a +4% move). Just be ready for turbulence at that price.
For more educational content on candlesticks, volume profile, and support and resistance levels, you can visit the educational library real-life examples (not just some web infographics) through these links:
When you upgrade your subscription premium/paid, you have access to all the content
So for next week, the odds for a bounce are significant, and the Support and Resistance levels for next week play an essential role for all indices. In the case of semiconductors (SMH), there will be bullish momentum towards $219.4 as long as price stays above $194.7; a break below this key level could trigger a bearish move towards $176.7. For that reason a trader or investor can use as a reference $194.7 to set their stop losses according to their own risk tolerance (the exact level is not recommended since the levels can act as a bouncer as we have studied for bullish and bearish reversals).
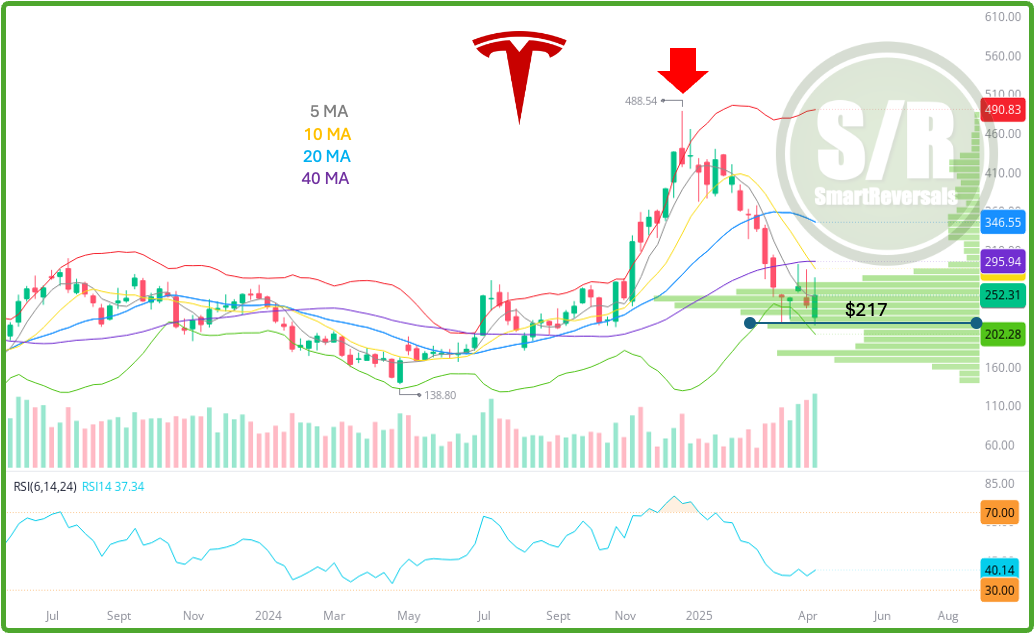
TSLA: Following the post-election euphoria and the bearish outlook shared with premium subscribers on December 21st, the stock entered a sell-off, breaching multiple support levels before finally attempting consolidation above $217, an annual level highlighted since January. Notice the confluence with the lower edge of the current volume shelf, and recent price action suggests a likely breakout next week. If $247.1 holds, bullish momentum towards $279.9 is possible; however, a break below this level could trigger a bearish move towards $219.4. Looking ahead one to two weeks, the $295-$303 range can be considered the bullish target for this bounce.
The same in-depth charts and analysis describing the current setups, with price targets and key support and resistance levels continues for SPX, VIX, NDX, IWM, Dow Jones, PLTR, DXY, GLD, SLV, TLT, MSTR, GOOG, AAPL, NVDA, META, MSFT, AMZN, and BTC; with volatility and breadth indicators analyzed. If you actively invest or trade any of these securities, this publication is essential for making informed investment decisions.
SPX at a Turning Point: Bottom or Temporary Bounce? 3 Indicators to Monitor: