Navigating the Market's Tides: The Power of Elliott Wave Analysis
This is the perfect moment to analyze corrections and the pullback that was correctly anticipated by the latest Weekly Compass
Elliott Wave Theory is a popular approach to market analysis that helps traders and investors predict future price movements based on historical patterns. Developed by Ralph Nelson Elliott in the 1930s, the theory asserts that market prices move in repetitive cycles, driven by investor sentiment and behavior, often referred to as waves. These waves are categorized into larger cycles and smaller sub-waves as follows:
Major Cycles:
Grand Supercycle: The largest cycle, spanning decades or even centuries.
Supercycle: A significant cycle, lasting several years.
Cycle: A major cycle, typically lasting several years.
Intermediate Cycles:
Primary Wave: A major trend within a cycle.
Intermediate Wave: A smaller trend within a primary wave.
Minor Cycles:
Minor Wave: A smaller trend within an intermediate wave.
Minute Wave: The smallest discernible wave.
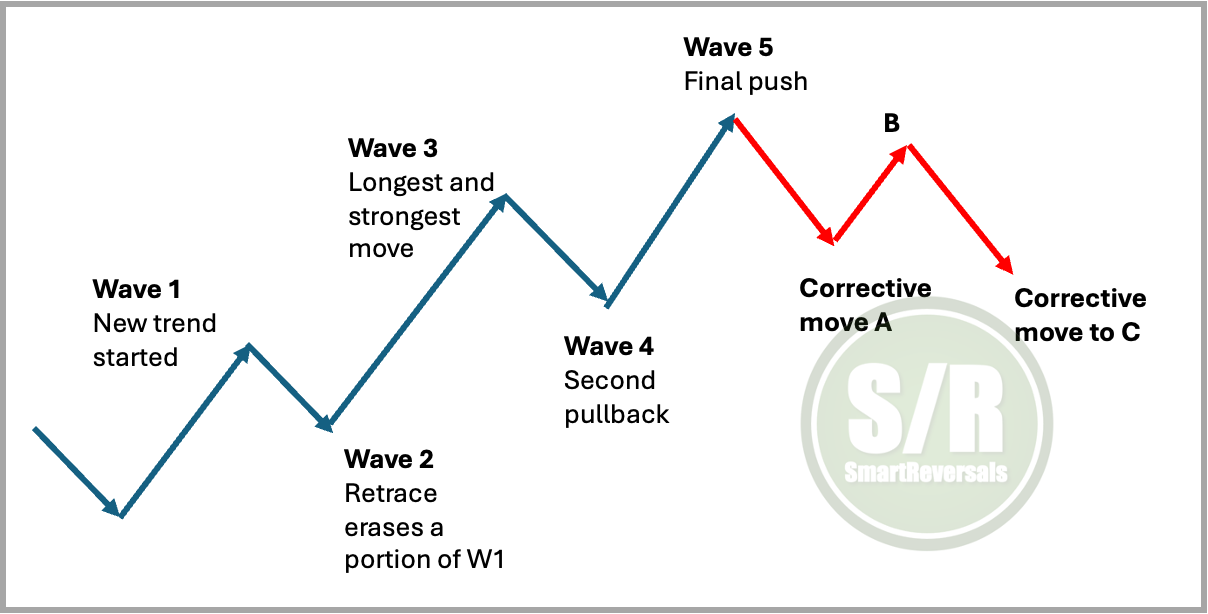
The theory posits that these waves follow a specific pattern: five impulse waves and three corrective waves. The impulse waves represent the direction of the trend, while the corrective waves retrace or pause the trend.
Impulsive waves: These waves move in the direction of the main trend. They are composed of five sub-waves, numbered 1 through 5.
Corrective waves: These waves move against the main trend. They are composed of three sub-waves, labeled A, B, and C.
Let's break down some principles in more detail:
Direction: Impulsive waves drive the trend, while corrective waves provide temporary pauses or retracements within that trend.
Number of sub-waves: Impulsive waves always have five sub-waves, while corrective waves typically have three. This difference in structure is crucial for identifying the type of wave.
Sub-wave structure: The internal structure of the sub-waves also differs. Impulsive waves have a 5-3-5-3-5 structure, meaning the odd-numbered sub-waves (1, 3, and 5) are themselves impulsive with five sub-waves, and the even-numbered sub-waves (2 and 4) are corrective with three sub-waves. Corrective waves, on the other hand, can have various structures, including zigzags (3-3-5), flats (5-3-5), and triangles (3-3-3-3-3). These different structures reflect the varying complexities of corrective patterns.
Overall pattern: Impulsive waves tend to be more straightforward and easier to recognize due to their clear five-wave structure and strong directional movement. Corrective waves, however, can be more complex and challenging to identify due to their varied structures and sideways or overlapping price action.
Wave 2: It cannot retrace more than 100% of wave 1
Wave 3: It cannot be the shortest wave
Wave 4: It cannot enter into the price territory of wave 1
Wave B: A temporary reversal that can give the impression of a new trend.
Wave C: Often equal in length to Wave A, completing the corrective pattern.
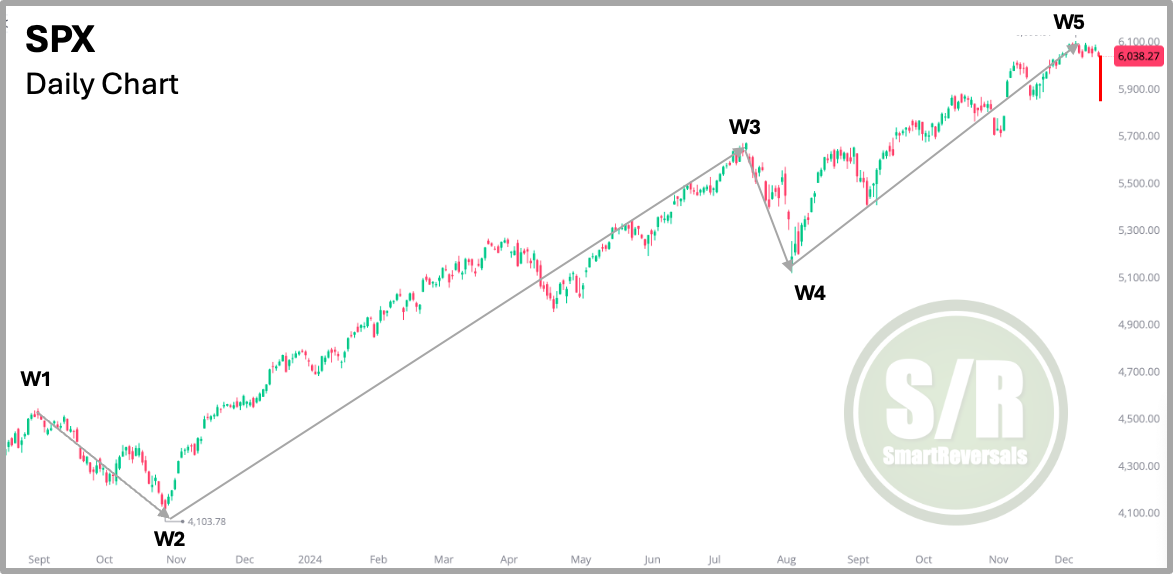
S&P 500 - A Visual Example
The chart highlights a clear example of an impulsive move that is consistent with the principles mentioned:
Understanding these cycles and their patterns can help traders identify potential turning points and predict future price movements. It's important to note that Elliott Wave Theory is a complex tool that requires practice and experience to master, it is comparable to other trading principles like volume profile or Fibonacci, where the criteria of the analyst plays an important role. Bollinger bands, RSI or moving averages are formulated indicators that require less judgement from the analyst in terms of setting parameters.
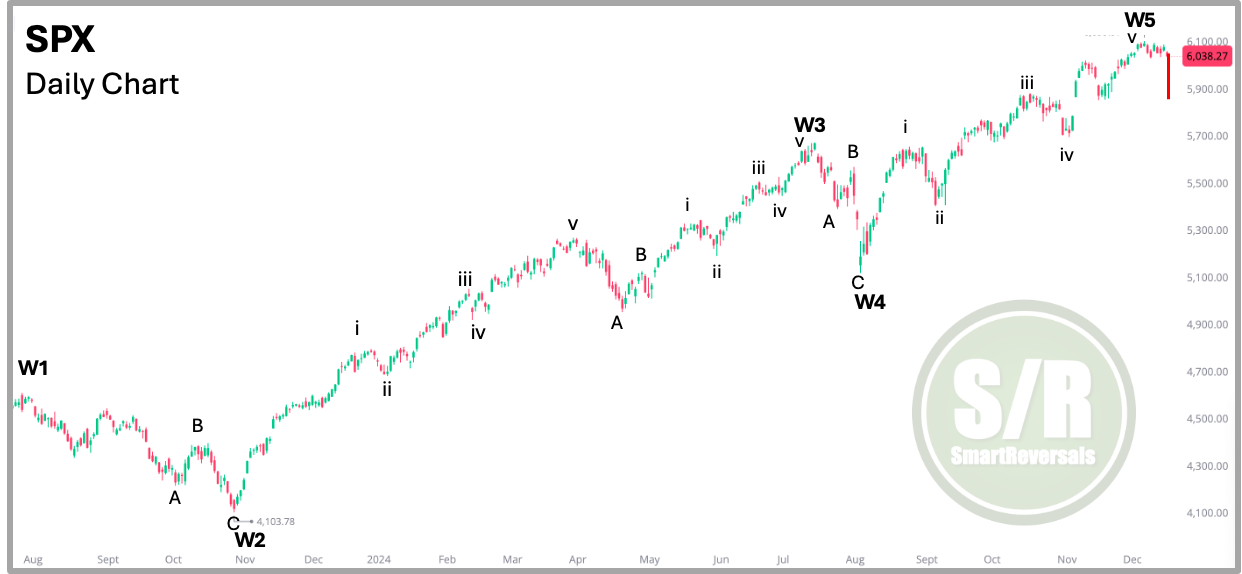
S&P 500 - Sub-Waves Example
The same chart includes internal moves with corrective waves between W1 and W2, impulsive waves from W2 to W3, and so on.
It’s interesting that in April 2024 there is an A - B move but not a clear C. We will study three imperfections (if you allow me to use that term) such as Zig Zags, Flats, and Truncations.
Other Principles of Elliott Wave Theory
1. Market Psychology: Elliott believed that waves reflect the collective psychology of market participants. The market moves in waves due to the emotional responses of traders—optimism and pessimism.
2. Fibonacci Ratios: Elliott Wave Theory often incorporates Fibonacci ratios to forecast price levels and wave targets. Common Fibonacci levels (23.6%, 38.2%, 50%, 61.8%, and 100%) are used to identify potential reversal points and target prices. There is an educational content about Fibonacci Retracement that you can visit here:
3. Applications of Elliott Wave Theory:
3.1. Trading Strategies: Traders utilize Elliott Wave patterns to identify potential entry and exit points. For instance, entering a trade at the beginning of Wave 3, which typically has the strongest momentum.
3.2. Risk Management: Understanding corrective and impulse waves helps traders manage risk. If a trade goes against the anticipated wave sequence, they can implement stop-loss measures.
3.3. Market Forecasting: By identifying existing wave patterns, traders can project potential future price movements. For example, if an impulse wave is identified, traders might expect a subsequent corrective wave.
Before continuing, let me write a special mention: The warning signs raised by the Weekly Compass last Saturday came true, I was hesitant about using a bear in the cover since many people were (are?) in euphoria, but my commitment is to bring you neutral analysis, and the market was screaming that a pullback was coming - Upgrade your access! Remember that Substack is a global platform that provides transactional safety to writers and readers:
Remember when I have raised the ironic scenario of a red December. My observations of the current price action are below the Elliott Wave content.
The next section studies Zig Zags, Flats, Truncations; and three essential charts with Elliott Wave or Fibonacci sequence applied: One for Tesla and two for SP500 with a long term view, which is building on the cautionary measures that the market suggests in terms of macro and other technical indicators. The analysis includes a pattern observed in most of the latest bear markets since 2000.


