One Year of Premium Market Insights
From an X Account to a Premium Experience - Market Update
This platform marks its one-year anniversary today. I sincerely appreciate your subscription and pledge to continue providing the most objective technical, macro, and fundamental analysis. Currently, more than 27,000 readers from 156 countries and every U.S. state rely on this publication. Thank you for your support. I will strive to enhance this service and guide you through the complexities of the market.
As evidence of my commitment to neutral and technically driven analysis, I point to my bullish outlook during the August 5th market decline (link below), a period when technical indicators clearly indicated extremely oversold conditions, suggesting an imminent bounce. Furthermore, amidst divided sentiment leading up to the September rate cuts, I authored a series of three publications analyzing historical price action post-rate cuts.
Today, with the market striving to rebound from a selloff anticipated in February, the special Elliott Wave and Major Correction studies published recently continue to provide valuable insights and act as a reliable guide for the prevailing price action (also links below).
Bullish in the middle of the panic: NIKKEI: How Much Lower Can the Sell-Off Go?
Warning Signs in the middle of the euphoria: Vanishing Bounces, Soaring Volatility: Is the Market About to Break?
Study instead of speculation ahead of rate cuts: Decoding the Fed: A Visual Exploration of Interest Rate Changes
Study instead of euphoria when indicators were raising warning signs:
Navigating Major Selloffs: 3 metrics To Watch: This publication provides a navigation of the selloff, based in clear metrics that have been observed during previous corrections, including the “Trade War and Government Shutdown 1.0” in 2018.
Navigating Market Crossroads: A Technical Study of Historical Corrections: For a long term perspective, this edition presented specific facts about previous corrections and what can be expected if the selloff continues after the incoming bounce.
Navigating the Market's Tides: The Power of Elliott Wave Analysis: After a whole year bullish, I stated since September that $6,100 was going to bring a major rejection, I published this special edition anticipating potential move incoming. A fake move after inauguration delayed what we’re seeing today and anticipated back then.
Let’s continue with a brief market update:
SPY
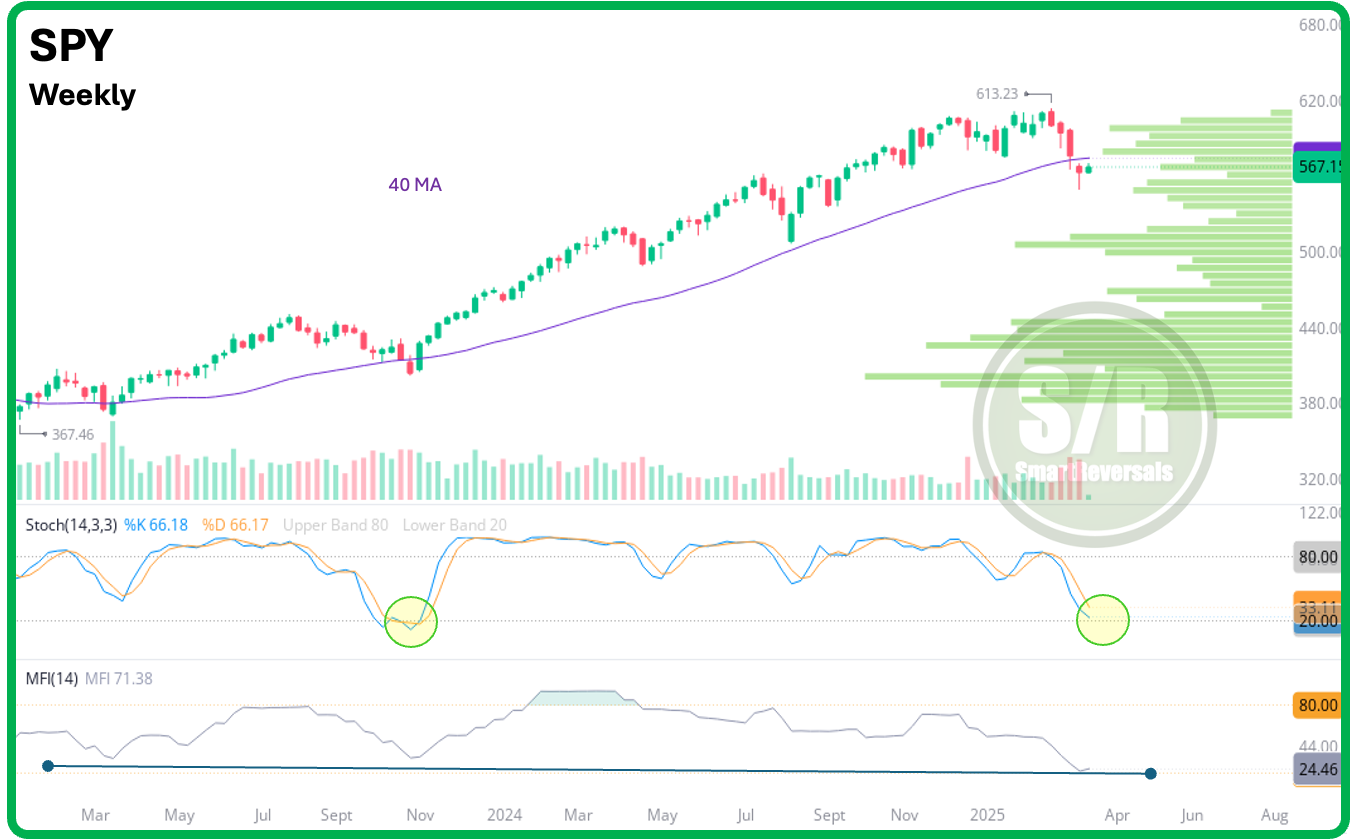
As forecasted last Saturday in the Weekly Compass click here, the weekly formation indicates an impending bounce. While indicators like the Money Flow Index are at long-term lows, the Stochastic is not yet oversold. To assess the bounce's sustainability, recovery of the 40-week moving average (currently $574) is crucial, as this level often distinguishes between pullbacks and bear markets. This represents a potential 1.3% upside from today's close.
Premium subscribers know I utilize levels to anticipate reversals or to validate moves; SPY bounced from $549.2, a monthly level calculated in February's Weekly S/R Levels edition (click here for the latest edition covering 35 securities).
Today, SPY remained above $560.7. However, given the afternoon's weak price action, reaching $571.7 (the immediate bullish target) in a straight line tomorrow seems unlikely. SPY's key levels are: Resistance: $565.2 (today's rejection at a monthly level), $571.7, and $575.7 (Confluence with the 40 weekly MA). Support: $560.7 (key level to invalidate the bullish thesis), $551.8, and $549.5 (recent correction low).
Conclusion: The chart suggests a bullish reversal as long as price stays above $560.7 and the $575 zone is essential to be conquered by bulls.
QQQ
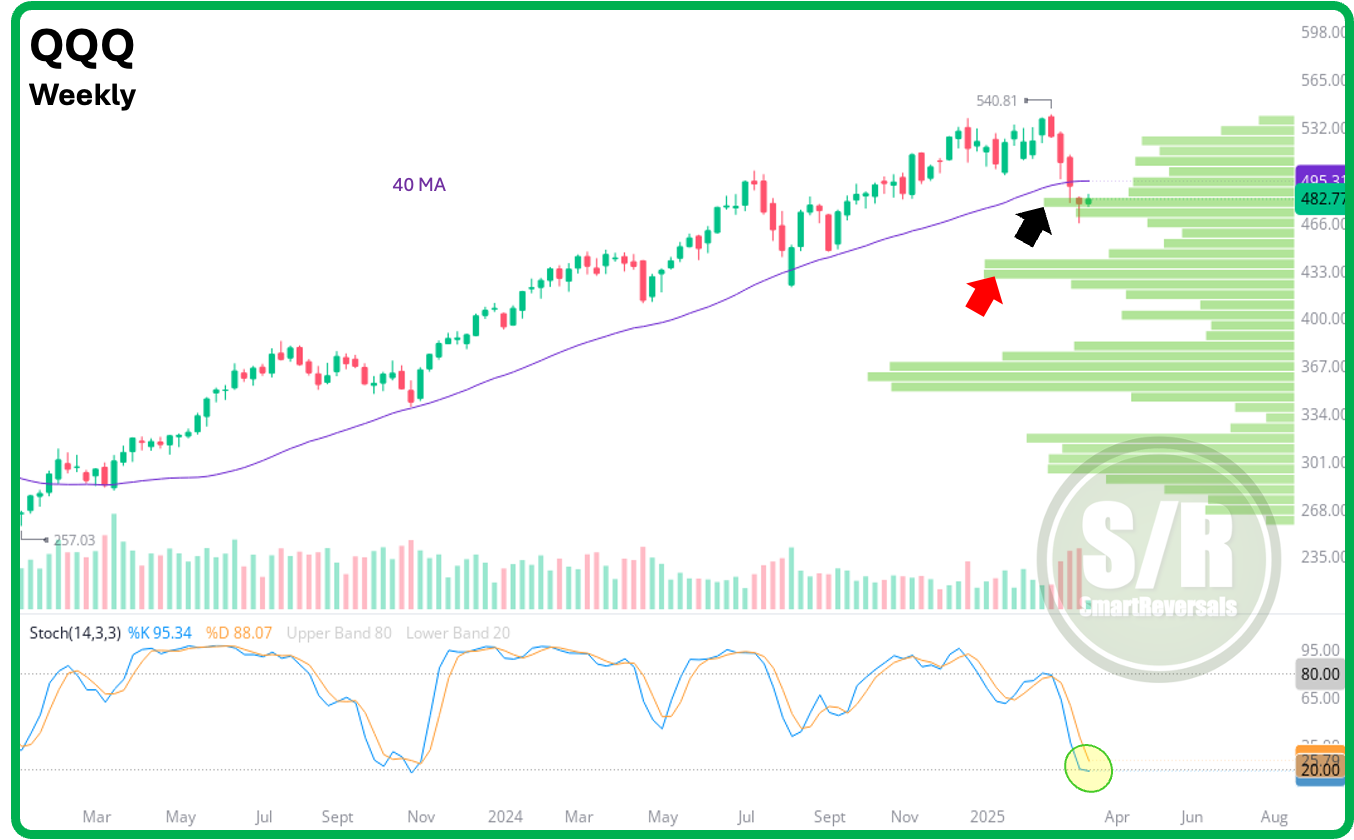
During the weekend, the bullish target for major tech stocks was established at $486.9, which precisely identified today's rejection point. This level was provided to premium subscribers in advance last Friday. The current volume shelf, indicated by the black arrow, is crucial for maintaining support; failure to hold this level could result in a decline to the lower volume zone, marked in red, which coincides with the $430.9 annual level.
The bullish scenario remains intact as long as QQQ stays above $476.7, with a potential ascent to $486.9 contingent on favorable futures activity tonight. The subsequent significant resistance areas are $489.5 and $494.2, with the latter potentially serving as a major resistance barrier, given its alignment with the 40-week moving average.
AMZN
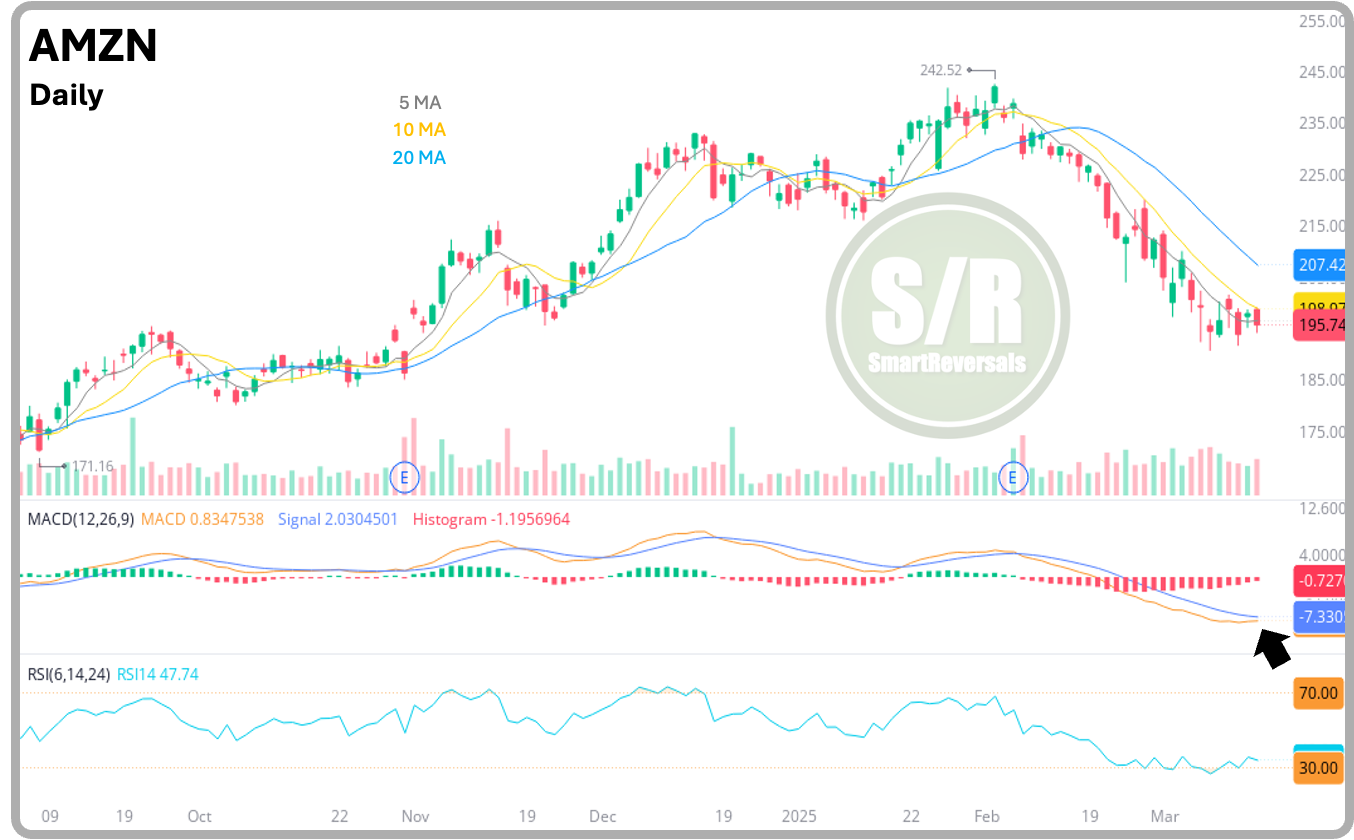
The stock encountered resistance today at the 10-day moving average (DMA), but crucially, at the $200 annual level, which requires a successful breach to initiate a selloff recovery. I've opted for the daily chart analysis due to the potential MACD crossover, a bullish indicator that would validate the most optimistic perspectives.
However, given the breach of the $196.8 central weekly level, the stock closed today in bearish mode, a thesis further supported by today's daily candle. Although the RSI is oversold, the possibility of a bullish divergence, leading to a further price decline, cannot be dismissed. The weekly setup, as outlined last Saturday click here, needs price retention above the critical level to support a bounce, as the current setup is not robust.
$196.8 is the most important resistance to flip to support, and then we would be considering $197.1 and $198.0 for analysis. in the meantime, if that resistance is not recovered, the next levels to watch are $192.0 (which if lost the weekly chart would be aiming at the lower annual level), but before that, $186.1, and $184.8 would be the last hope for a bounce.
MSFT
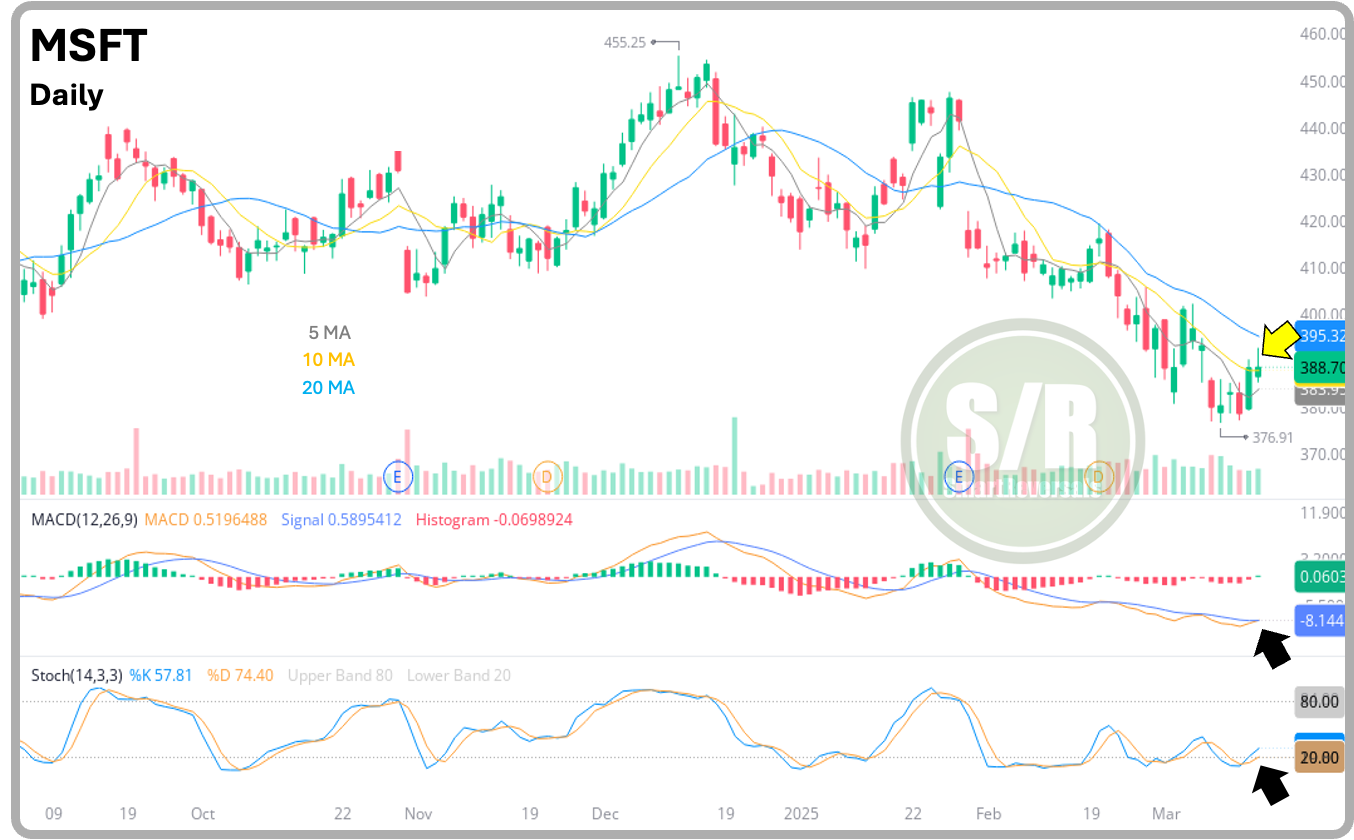
A MACD crossover is imminent for Microsoft, the daily candle is not convincing for bulls and it’s very similar to the ones from March 6th and February 20th, but given the conditions studied last Saturday, it’s time at least for a reset of oversold indicators, even before a further decline.
The chart can be analyzed using the 20DMA, but even better if $385.2 is considered as line in the sand for bulls, a level that once breached would endanger the bullish thesis and would set $380 as the next destination target. if the setup finally gains traction and the key level is maintained, the closest resistance levels are $393.6, $397.3, and $398.6.
IWM
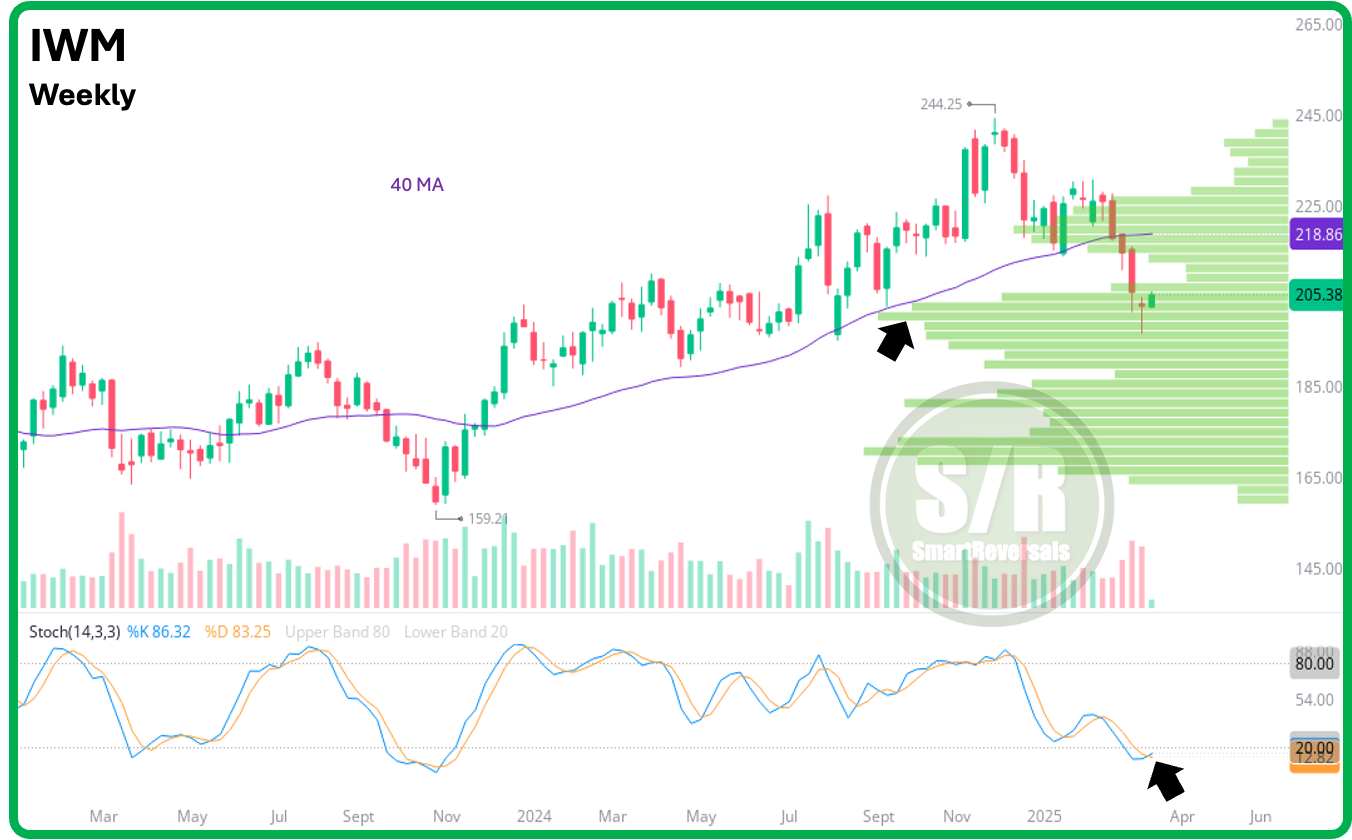
Price bounced from the point of control highlighted with the black arrow, and while the daily candle is encouraging, the 4 hours timeframe shows a potential bearish reversal candle that found rejection precisely at $206.1; the immediate bullish target published in advance last Friday in the S/R Levels edition click here.
Considering the rejection at the precise level, and the volume gap observed in the chart below, caution is key. The Stochastic suggests the bounce is just starting, but turbulence is very likely considering that gap. Today, $201.5 remains as the level that supports the bullish thesis this week, and if $206.1 is finally conquered with a solid candle in the 4H or 2H timeframes, price could be aiming at $209.3, for a rapid move between volume shelves.
Thanks for reading, for all the monthly and weekly levels, or the technical charts with all the indicators consider upgrading your subscription and use all the links provided.
This market research and educational content is not intended to be investment advice.





Thanks for your work!
Congratulations! and thanks for your insights! best in class.