


Oversold Indicators and Price Action Point to a Bounce
14 Securities with bouncy setups - Price targets and levels to manage risk


Following a second consecutive week of choppy trading, bull conviction has significantly diminished, while bears struggle to capitalize on daily setups. Though oversold, price rebounds are consistently vanishing at resistance levels. Next week the market is expected to find directional resolution.
This publication tracks many securities in a consistent way every week, and in the middle of the storm bullish setups posted in recent weeks for PLTR, MSTR, and MSFT have been validated by price action 🎯. Last week as well, bearish exhaustion was anticipated for SPX, NDX, Bitcoin and Tesla. Technical indicators are primal.
For those seeking clarity amidst this volatility, recall the three publications that accurately predicted these market dynamics. A premium subscription unlocks access to these analyses and the site's complete archive, click on each title:
Navigating Major Selloffs: 3 metrics To Watch: This analysis guides you through the current market downturn, utilizing established metrics that have proven reliable during past corrections, including the 2018 'Trade War and Government Shutdown 1.0' event.
Navigating Market Crossroads: A Technical Study of Historical Corrections: For a long term perspective, this edition presented specific facts about previous corrections and what can be expected if bounce attempts continue vanishing.
Navigating the Market's Tides: The Power of Elliott Wave Analysis: After a whole year bullish, I stated since September that $6,100 was going to bring a major rejection, I published this special edition in December 2024 anticipating the bearish move incoming. A fake move after inauguration delayed what we’re seeing today and anticipated back then.
The market today
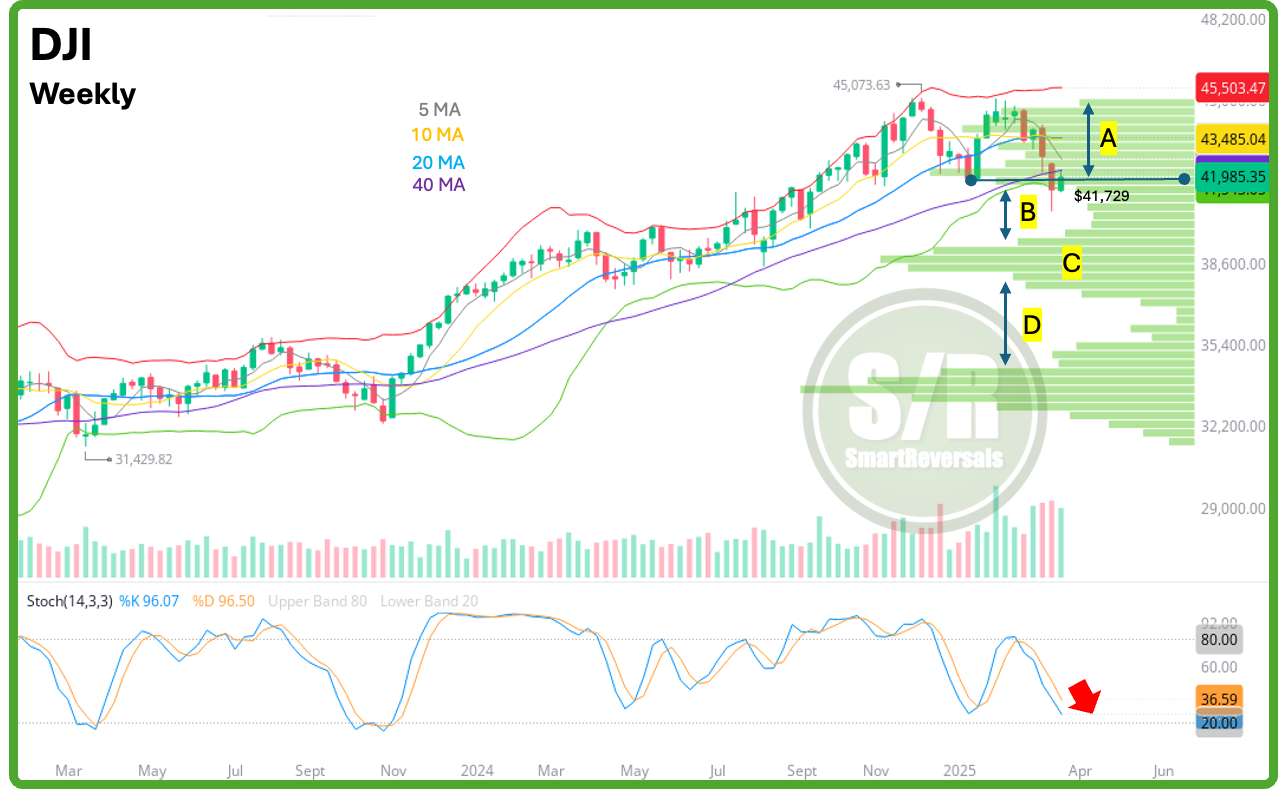
DOW JONES - The godfather of the indices shows how price is at a critical “make or break” level
Based on the volume profile indicator, see the different shelves and gaps between them as follows:
A) The indecision candle that anticipated the reversal in February happened at the higher edge of the shelf, since the reversal occurred, the move from the top to the bottom happened rapidly.
B) Price action is looking for consolidation at the lower edge, in confluence with the annual $41,7K level. A loss of the current shelf could send price rapidly through the volume gap B, as you will see it happened with IWM in the following chart. Price action travels rapidly in volume “limbos”.
C) Is the next strong support level if the $41.7K zone is lost, next week we will learn if the 40MA acts as a strong resistance.
D) Is a more dramatic volume gap, which as of now is presented since it is part of the chart, but as of now let’s be focused on A, and the possibility of migrating to B.
Which direction? The index today suggests a bullish continuation if the key level of $41,882.8 continues as support and more important, if the monthly $42,103.7 level that set resistance during all the week is conquered. If those two conditions happen, the immediate bullish target of $42,352.8 (very close to the 40MA). Conversely, if the price breaches $41,882.8 and drops to $41515.3, it would indicate a potential bearish reversal. If the bullish target is conquered, the next level to watch is $42,720.3.
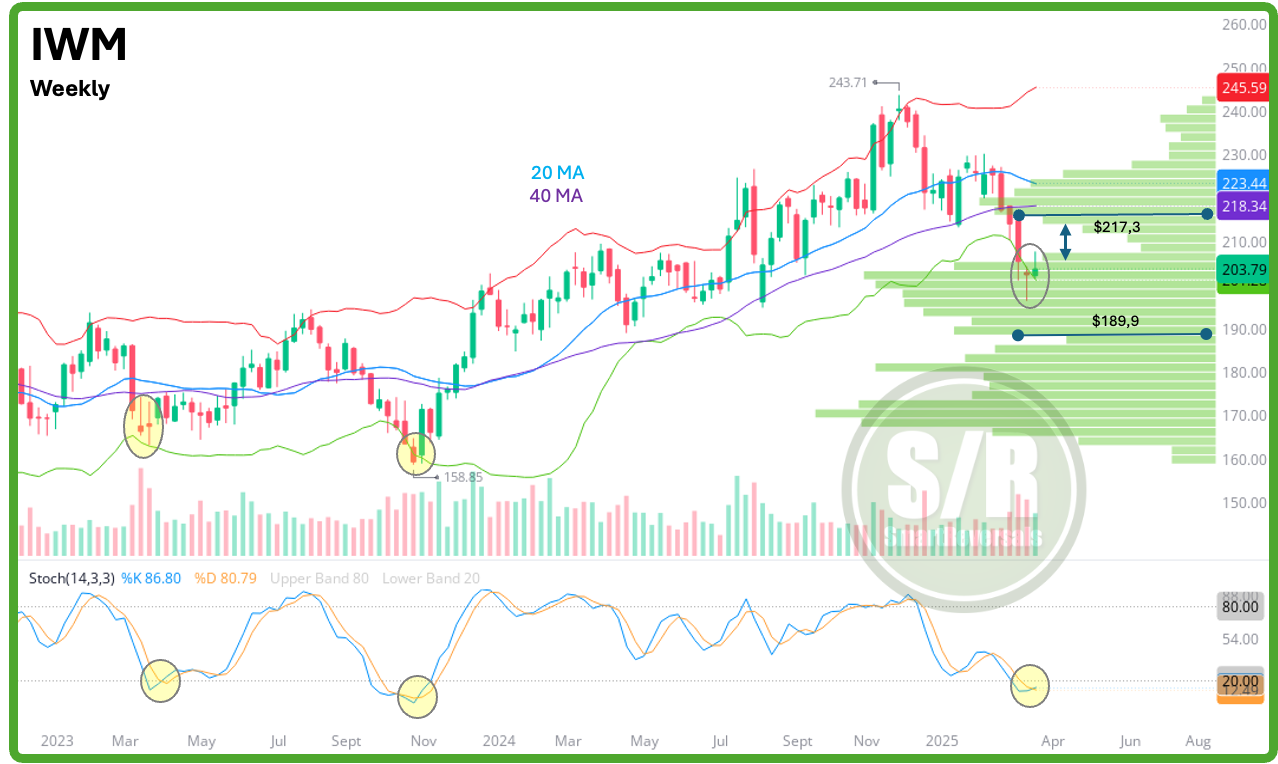
IWM - This is what happens when a volume shelf is lost
See the rapid move when $217 was lost; the volume gap was passed quickly and price action today is trying to find support at the higher edge of the volume shelf. The difference with Dow Jones is that oscillators are oversold already and price action shows two consecutive weeks of indecision, opening the technical doors for a bounce. This type of indecision at the lower Bollinger band has preceded bounces as highlighted in the chart.
Small caps would confirm the bullish reversal if the price recovers $204.4, with an immediate target of $207.1. If price action doesn’t make it above $204.4, the potential bearish reversal towards $201.1 would be likely.
The same in-depth charts and analysis describing the current setups, with price targets and key annual support and resistance levels continues for SPX, VIX, NDX, SMH, PLTR, DXY, GLD, SLV, TLT, MSTR, GOOG, AAPL, NVDA, META, MSFT, TSLA, AMZN, and BTC; with volatility and breadth indicators analyzed. If you actively invest or trade any of these securities, this publication is essential for making informed investment decisions.
Last week, the charts open for everyone were SMH and PLTR (as today DJI and IWM), presenting bullish setups; one was confirmed for PLTR since the stock jumped 5% this week 🎯; while SMH continues with constructive price action.
SPX - The Importance of the Support and Resistance Levels
Every Friday a set of levels is published for the next week, those levels have proven to be a reliable frame of the incoming price action.
Those levels include a central level among layers of support and resistances, that central or key level is charted below with a blue line, and when it is breached by a 2H or 4H candle a sell signal is triggered. The central level was the confirmation of the major top thesis one month ago.
During the recent weeks, price action has done a rapid down move and stays in specific ranges based on the S/R levels posted before price action occurs, and for 35 securities, for access to the levels for next week click here.
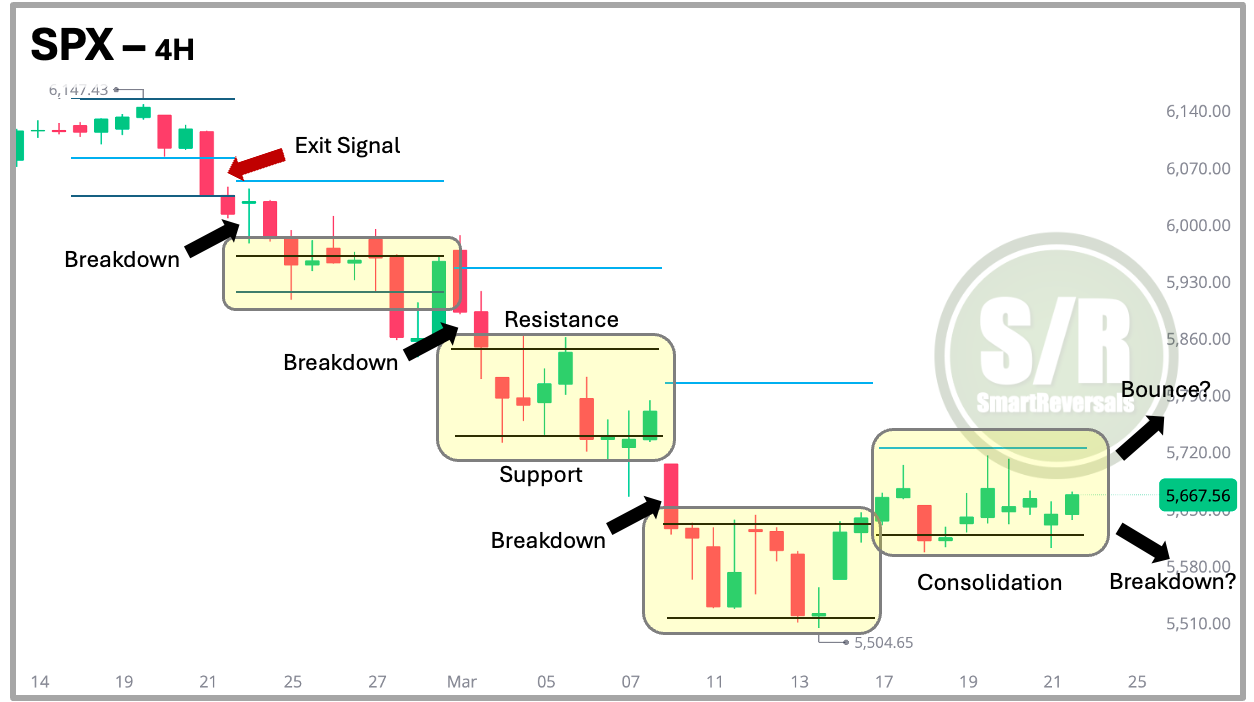
The latest price action showed signs of consolidation, the levels for next week are below, with the technical reading that suggests the direction for next week.
In this publication I use volume profile and Bollinger bands for most of the charts, and the most interesting element is that price reached the lower band and volume shelfs that one month ago would have sounded simply improbable. Nothing is improbable for the market when an indicator is raising a flag. For Educational content click in each one of the following three links. A paid subscription grants you access to all the links shared: Bollinger Bands - Volume Profile - Educational Technical Library
SPX - BOUNCE OR BREAK SCENARIO? THE ANSWER IS HERE: