


See the Story the Charts Tell: Candlestick Patterns Decoded with Real-World Examples
This Second Edition of Price Action Goes Beyond Books with Fresh Examples - SPX, GDX, DAX, NVDA, AAPL, IWM and more.

Candlesticks are a fundamental part of price action trading since they are the building blocks used to visualize price movements over time. Price action analysis focuses on understanding the raw price movements themselves, without relying on additional indicators. Here's how candlesticks play a crucial role in this analysis:
Visualizing the Battle Between Buyers and Sellers:
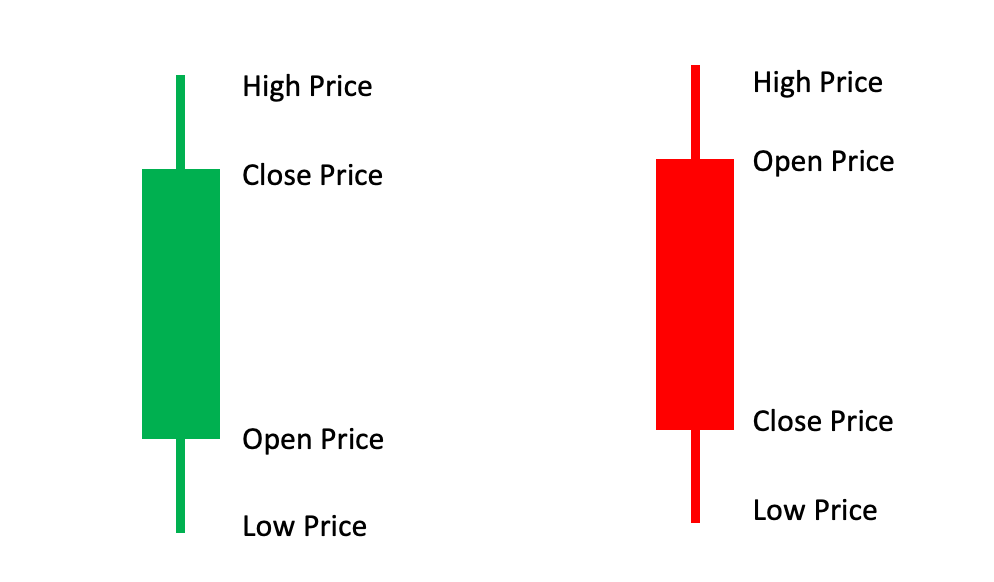
The body of a candlestick represents the open and close prices, essentially showcasing the tug-of-war between buyers and sellers throughout the timeframe.
Body Color:
Green: It means the closing price was higher than the opening price. This suggests a price increase during that timeframe.
Red: It means the closing price was lower than the opening price. This suggests a price decrease.
Wicks (or Shadows): These are thin lines extending from the top and bottom of the body. They represent the highest and lowest prices reached during the timeframe.
Upper Wick: The difference between the highest price and the closing/opening price.
Lower Wick: The difference between the lowest price and the closing/opening price.
Identifying Trading Opportunities:
By analyzing the size and color of the body, along with the length of the wicks, price action traders can identify potential trading opportunities.
For example, a large bullish candlestick with a short upper wick might suggest strong buying pressure that pushed the price significantly higher, potentially indicating a continuation of the uptrend. Conversely, a small bearish candlestick with a long lower wick might show selling pressure despite a temporary price drop, hinting at a possible reversal.
This educational content illustrates different types of candlesticks with fresh examples for AAPL, TSLA, SPX, IWM, NVDA, GDX and more.
Candlestick theory often differs from reality, a good trader doesn’t look for textbook perfection in a candle formation or setup, this edition of Level Up Your Trading presents actual examples that can provide you flexibility with certain parameters when analyzing a chart.
Confirmation and Context: