


Support and Resistance Levels Prove Reliable
Get Access to this Essential Tool to Navigate the Stock Market Next Week


Last weekend's technical analysis immersion anticipated a critical "break or make" week. This outlook stemmed from the price bounce off oversold levels two weeks prior. However, the subsequent decline warranted caution, leading to the following criteria being posted on Sunday:
“The three elements to watch to consider a bounce:
VIX must break below 29
SPX has to recover $5,321
NDX must recover $18,456 (Earning Reports season)
Percentage of stocks above 200 DMA above 30%”
I ended up providing four elements, since after charting all the tech stocks, I found that NDX was going to be a major driver this week. For access to the previous weekly compass, click here.
Monday brought a very bearish day that affected significantly the charts, but also that day the following was mentioned in a special publication:
“Technically speaking, the best scenario for longs is some kind of consolidation above $5,082, curling up that lower band that is looking extremely bearish. If tomorrow, the price closes above that level, pay attention to solid candles, not dojis, shooting stars or anyone showing indecision or rejection (in case of a red one after a higher open).”
By Tuesday, the market rallied, consolidating $5082 ✅, recovering $5,182 (next level), printing a bullish candle ✅, and curling back up the Bollinger band ✅, this chart was posted on Substack notes:
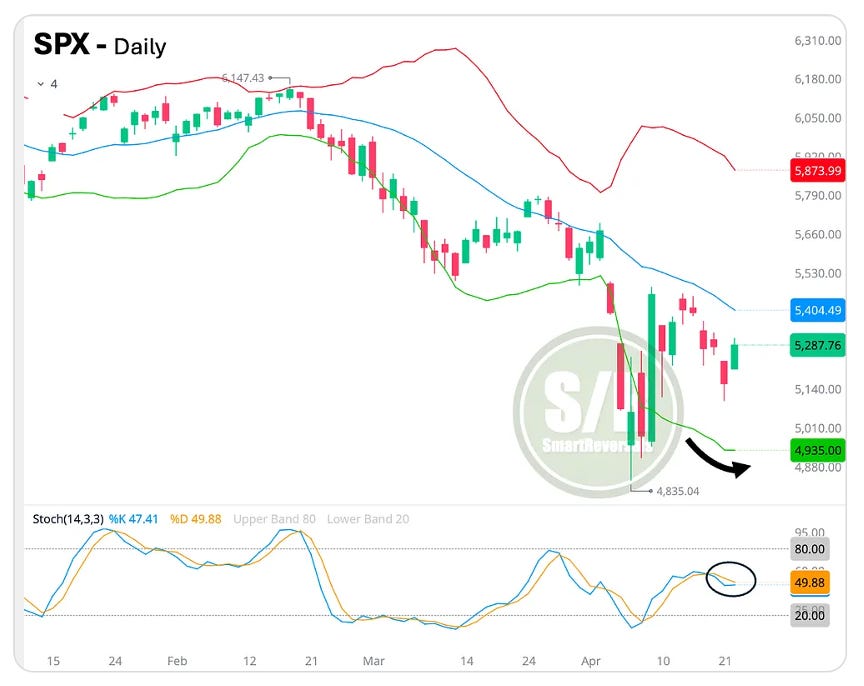
What happened during the rest of the week is common for a bottoming process, there is confusion potentially negation or frustration; that is human, it is normal, and if this is your first bear market you just lived the emotions that cannot be captured when you see historical charts. My main message here is how useful were the support and resistance levels, on Monday after the selloff I adapted the level to watch to $5,082, and it worked out. In addition my publication on Wednesday was focused on the historical study of bear market bottoms. For access, click here.
When a level is breached, in this case $5,182; the lower one can act as a bouncer, hence my focus on $5,082 after Monday’s selloff.
The price moves have been violent, the levels of uncertainty are extreme considering the communications from the White House that have shaken the markets. Trading is not about perfection but about preparation, so the ideal of buying at the very bottom is something that is not impossible, I have posted publications calling bottoms like on August 5 2024, but this time the setup was blurry. Don’t feel bad if it has been difficult to navigate the indicators, for that reason the Support and Resistance levels are the best tool to validate price action moves and weak setups, even more during these days.
The final weekly pathway was the following for the SP500, and see how related it was with the Support and Resistance levels published last Friday:
Two things are impressive: a) The price action covered all the levels, different and out of the regular range that in this case was between $5,182 and $5,421; and b) the importance of $5,082 as the line in the sand published on Monday. The candles left gaps, and there was a shooting star on Wednesday, but as we have studied, the levels provide the last validation, and as long as price moved across the levels, it never breached the one overcome.
The content above described SPX only, and the Support and Resistance Levels are updated every week for 35 securities including: SPX, NDX, DJI, ES=F, NQ=F, SPY, QQQ, IWM, DIA, SMH, TLT, NVDA, META, MSFT, AMZN, GOOG, AAPL, TSLA, NFLX, COST, MSTR, PLTR, AMD, GLD, SLV, BITCOIN, ETHEREUM, TQQQ, SQQQ, UPRO, SPXS, UDOW, SDOW, URTY, and SRTY. If you trade some of those securities, this publication is for you.
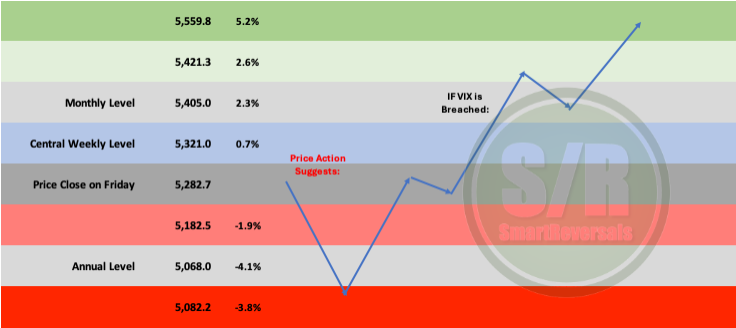
WEEKLY LEVELS:
When the percentages below the black arrow are negative, they are representing the distance from the central level, meaning that the price closed on Friday above of next week’s central level, for the securities that have that condition, they are entering next week with bullish conditions; the opposite for the ones highlighted in red, which means that the close on Friday is below next week’s central level: