Tariff Headlines Ignite Overheated Indicators
Overbought indicators and some weak earnings reports created a vulnerable market, with tariffs acting as the trigger for the pullback
Every major market event, from the COVID crash and the Great Financial Crisis to the dot-com bubble burst and even the 2018 bear market (triggered by trade wars), has been foreshadowed by technical indicators flagging a pullback. Overbought conditions, complacent sentiment (as measured by technicals), and impending volatility spikes have consistently aligned as warning signs—even before Black Monday in 1987.
Several warning flags are emerging for the S&P 500. The post-inauguration rally created three daily gaps, the VIX reached oversold territory last week, and overbought conditions exist on both monthly and weekly timeframes as studied in the latest editions of the Weekly Compass. Is a crash coming? Price action has to answer that question, but it’s worth noting that overbought conditions demand caution.
This edition brings a market update for the SPY, and the fundamental and technical ones for Netflix, Meta, Apple, and Microsoft. Tesla is a plus in a separate section at the bottom.
S&P 500 - The Market Today
Last Friday, in the S/R levels edition, the following was stated:
SPX Futures (ES=F): Potential bearish reversal target if the key level is breached: $5,958.9; with possibilities to reach $5,854.8
SPY: The near-term bearish objective is: $594.3, with possibilities for $586.8
OUTCOME AS OF TODAY: The futures (ES=F) bottomed overnight exactly at that area, price action moved around $5,958.9 during 12 hours before bouncing; and the SPY is trying to find support also above $594.3.
This was anticipated based on technical analysis. Remember that stock market transactions are largely driven by algorithms that follow the same technical indicators and price action you see on your phone app. Study and experience to manage those indicators are key for trading success.
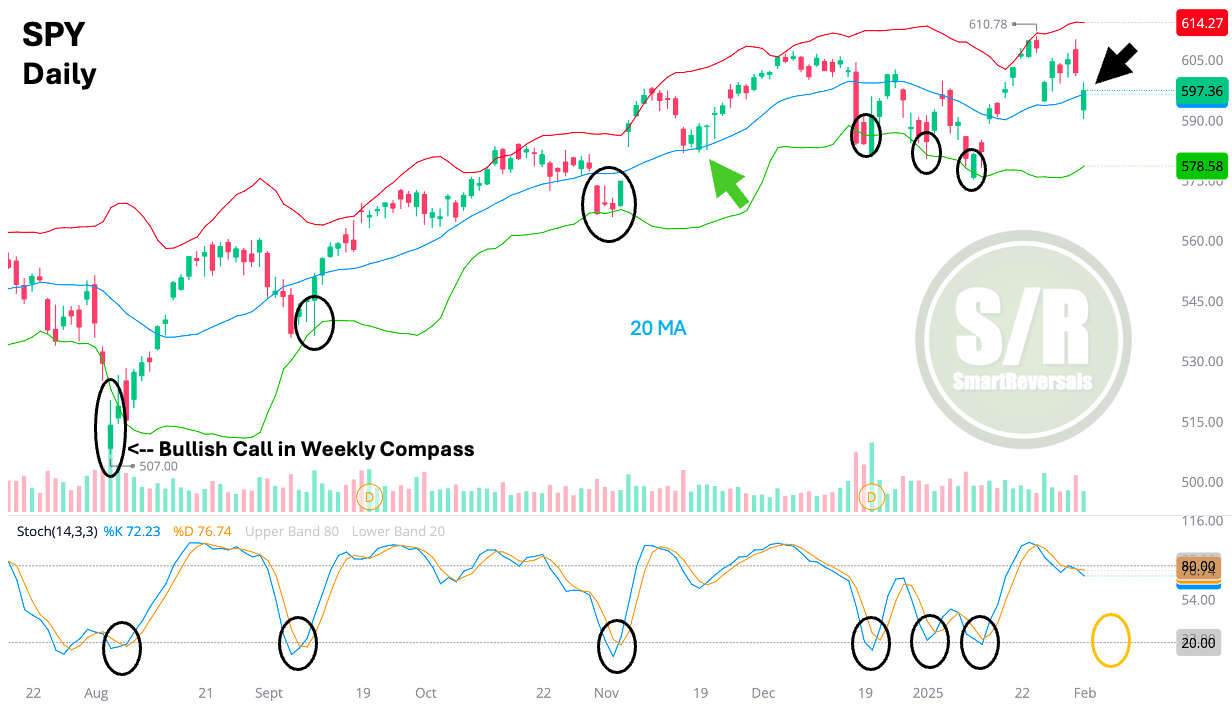
The chart for SPY is showing a bounce, the candle is green and $594 is supporting price as expected. People who were subscribed on August 2024 may remember my bullish call right at the bottom of the selloff caused by the carry trade in Japan, back then daily price action breached the lower Bollinger band, the oscillator was oversold, and the candle suggested a bullish reversal.
Today, as highlighted by the black arrow, the price is not completely oversold, it just reached the 20daily moving average, and as also highlighted by the yellow circle, the oscillator is not oversold; both conditions that preceded bounces as also circled in different moments of the 2024.
Price can bounce from this level, but check again the 20 moving average, it is mostly in resistance mode, the candle is trying to recover that position. Risk reward is not entirely in favor of the bulls, but for any long entry, using $594 as a reference (below that level is better) to exit is prudent, since $5,854.8 is not ruled out for the futures, like $586.8 for SPY.
This edition offers a fundamental analysis update of key mega-caps following their recent earnings releases, complete with accompanying technical charts. This is the charts-for-everyone [free] edition where you have a glimpse of both the fundamental and technical analysis provided by SmartReversals.
For the latest Weekly Compass get access here, and for the Support and Resistance Levels get access here.
ER UPDATE AND TECHNICALS: NFLX - META - AAPL - MSFT - TSLA
The AI Factor: Reshaping the Landscape
The common thread weaving through these narratives is the transformative power of AI. From Microsoft's AI-driven products to Meta's strategic investments and even Apple's potential foray into AI-powered devices, the technology is reshaping the competitive landscape. Companies that successfully integrate AI into their products and services are likely to thrive, while those that lag behind risk falling behind.
Investment Implications: A Cautious Optimism
The tech sector presents a mixed bag of opportunities and challenges. While established players like Apple and Microsoft demonstrate resilience and strategic vision, others face mounting pressures. The rise of AI creates both exciting possibilities and potential disruptions. Investors should adopt a cautiously optimistic approach, carefully evaluating each company's ability to navigate the evolving landscape and capitalize on the transformative power of AI. Thorough due diligence, a long-term perspective, and a keen understanding of the competitive dynamics are essential for success in this dynamic sector.
Netflix: Streaming Giant Rides Wave of Subscriber Growth and Expanding Profitability
Netflix has delivered a resounding fourth-quarter performance, shattering expectations with record-breaking subscriber additions and demonstrating the power of its evolving business model. The streaming leader added a staggering 18.9 million subscribers—the largest quarterly gain in its history—propelling revenue growth to 16% year-over-year (19% FX neutral), exceeding its 14.7% guidance. This surge in subscribers, fueled by a robust content slate featuring high-profile titles like the Tyson vs. Paul fight, NFL on Christmas, and the return of "Squid Game," underscores the enduring appeal of Netflix's offerings.
Beyond subscriber growth, the company also showcased impressive financial performance, surpassing estimates for operating income ($2.27 billion vs. $2.19 billion estimated), earnings per share ($4.27 vs. $4.24 estimated), and free cash flow ($1.4 billion vs. $807 million estimated). The gains were geographically diversified, with each market contributing over 4 million net additions.
This quarter's results highlight the strength of Netflix's platform and its strategic positioning within the competitive media landscape. The company is benefiting from a confluence of growth drivers, including the rapid expansion of its advertising-supported tier (now representing 55% of net adds in ad markets), coupled with promising initiatives in gaming, live events, and sports. Furthermore, Netflix's scale is proving advantageous, as robust revenue growth and disciplined cost management are driving substantial operating margin improvement in 2024, with further expansion on the horizon.
Looking ahead, Netflix has raised its CY25 guidance, now forecasting 12-14% revenue growth (up from 11-13%) and a 29% operating margin (up from 28%), even with a $1 billion increase in foreign exchange headwinds. The company sees significant runway for further subscriber growth, citing 750+ million broadband households globally (excluding China and Russia) compared to its current subscriber base of approximately 300 million. With less than 10% viewership share in each market, Netflix also has ample opportunity to increase engagement.
As a result, revenue estimates for CY25 have been revised upward to $44.43 billion (from $43.86 billion), aligning with the higher end of the updated guidance, and operating margin is now projected at 29.1% (from 28%). CY26 revenue estimates have also been increased to $49.5 billion (from $48.3 billion), with operating income rising to $15.6 billion (from $14.5 billion).
In conclusion, Netflix's exceptional fourth-quarter performance, combined with expanding margins and a clear path to continued subscriber and engagement growth, positions the company for sustained success in the dynamic streaming industry. Its strategic investments in diverse content, expansion into new revenue streams like advertising and gaming, and focus on operational efficiency demonstrate a commitment to long-term value creation for investors. While competition remains fierce, Netflix's ability to adapt and innovate suggests it is well-equipped to maintain its leadership position.
Technical Update:
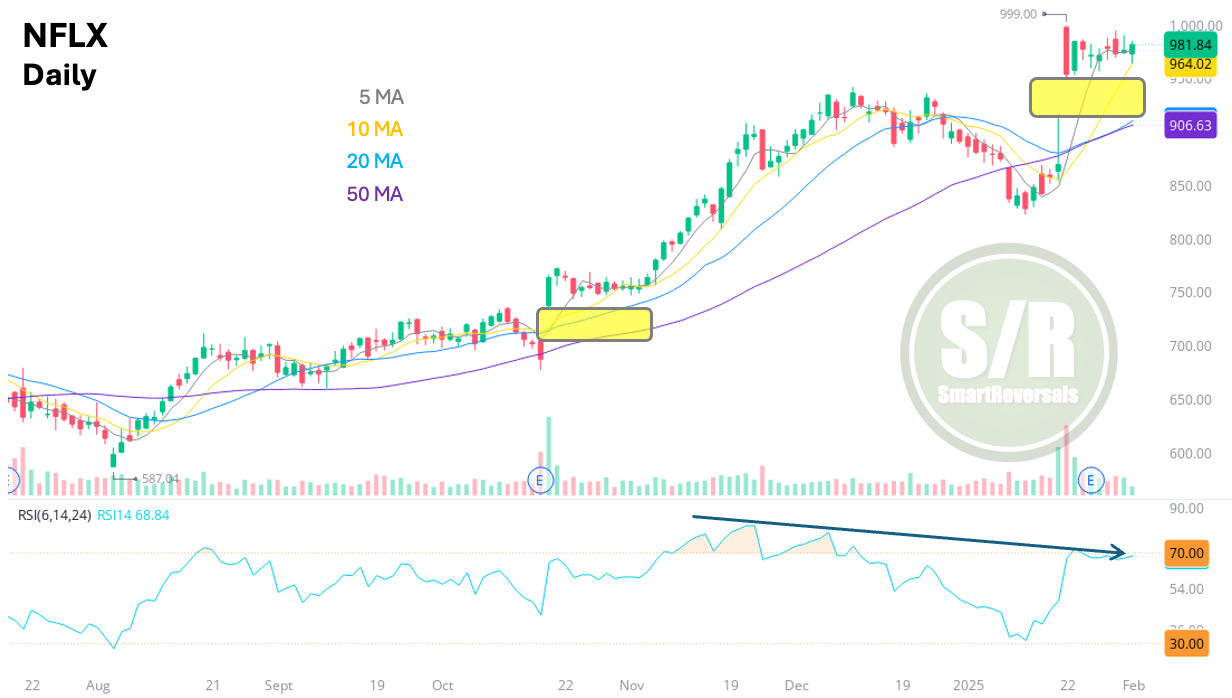
There is a new gap in daily price action, gaps are usually filled for the indices and some stocks, Netflix can leave a gap open for long time like Nvidia or Tesla, and the reason why I included this stock, is because it has performed better than some of the magnificent 7, in the end NFLX was part of the FANGs, before the 2022 bear market.
There is a bearish divergence with the RSI, a consolidation in this area is expected as it happened before the previous Earnings Report. The difference this time is that SPX and NDX have reached overbought conditions in long term timeframes, so this time a pullback may be closer, just observe the decline starting in mid December, a perfect mirror of the big indices.
The solid fundamentals (historical quarter as noted above) show how important is growth for a stock, and today, when the SP500 reached -1.7%, this stock was flat.
Key levels to watch this week: Bullish continuation if $976.2 continues as support, The next upside target is: $995.1, and the potential bearish reversal target if the key level is breached: $957.8
Meta: Investing in AI for Future Growth Despite Near-Term Expense Increase
Meta Platforms delivered a strong fourth-quarter performance, exceeding revenue expectations at $48.4 billion (a 21% year-over-year increase), surpassing the consensus estimate of $47.0 billion. This growth was fueled by strength in the eCommerce vertical and the increasing benefits from AI initiatives. Advertising revenue grew by 21% (same ex-FX), accelerating by one percentage point despite a tougher year-over-year comparison. GAAP operating income and EPS of $23.4 billion and $8.02, respectively, also exceeded expectations ($20.0 billion and $6.76 estimated) due to lower costs across various areas. The first-quarter revenue outlook of $39.5-$41.8 billion (8-15% year-over-year growth) brackets consensus estimates of $41.7 billion.
Looking ahead, Meta anticipates increased investment in growth initiatives in 2025, guiding for expenses between $114 billion and $119 billion (a 20-25% increase), exceeding the consensus estimate of $111 billion. This investment will focus on infrastructure and technical talent. It's worth noting that Meta has a history of conservative spending guidance. A key difference in this investment cycle compared to previous ones (like Reels) is that AI is already delivering tangible business results. For example, Advantage+ Shopping boasts a $20 billion annual revenue run rate, up 70% in the fourth quarter. AI's prominence as the top tech sector theme further justifies this increased spending.
Reflecting higher average revenue per user (ARPU) trends, 2025 revenue estimates have been revised upward by 3% to $188 billion. However, this is more than offset by the increased expenses, resulting in a 1% decrease in the 2025 EPS estimate to $25.16. Similarly, 2026 revenue is now projected at $216 billion (up 4%), with EPS slightly lower at $28.65. Capital expenditure estimates have also been increased to $62 billion for 2025 (down 11% year-over-year in free cash flow) and $68 billion for 2026.
In conclusion, Meta's strong fourth-quarter results and positive revenue commentary reinforce optimism surrounding its AI investments. While increased expenses in 2025 will impact earnings, the company's strategic focus on AI, which is already generating significant revenue, positions it for long-term growth. Sustained revenue growth and further evidence of AI's contribution to the bottom line will be crucial for validating the investment thesis and supporting the stock's valuation.
Technical Update:
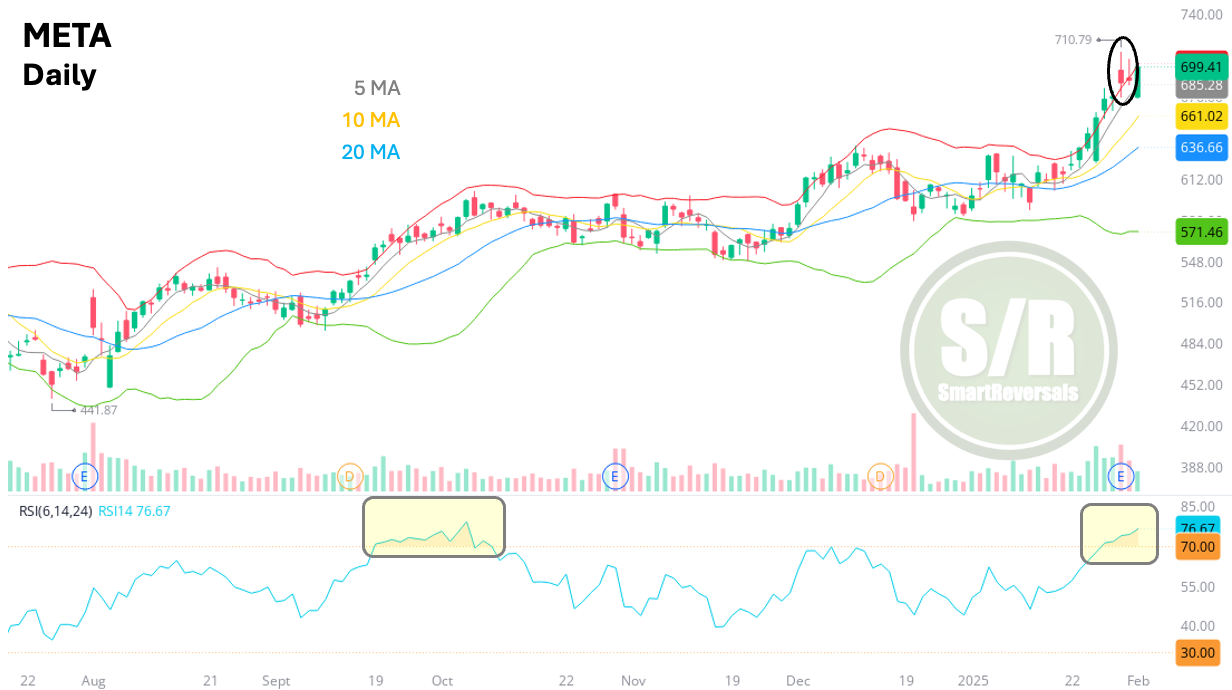
Daily RSI is overbought, a condition that preceded consolidations as it happened during the fourth quarter of 2024. The results were solid, but price also jumped above the Bollinger band, something to watch for META, since the return to the Bollinger range may bring a painful pullback.
Today the stock opened deep in the red, but it bounced precisely from $675, the central weekly level posted last Friday, and bounced with strength. Consolidation is still expected though.
Key Weekly Levels: Bullish continuation if $675 stays as support || Immediate target for bullish continuation: $724.9 || Potential bearish reversal target if the key level is breached: $639.3.
Apple: Riding Services Strength and AI Potential to New Heights
Apple's recent results and outlook paint a picture of resilience and innovation, driven by the strength of its services business, improving gross margins, and the promising potential of Apple Intelligence. Gross margin guidance for the second fiscal quarter (46.5-47.5%), even with significant FX headwinds, points to the positive impact of increasing vertical integration. Apple's diversified product portfolio and growing services segment continue to demonstrate their resilience against macroeconomic pressures. The company's robust cash flow and commitment to capital returns further enhance its appeal to investors.
Looking at regional performance, Greater China revenue declined 11% year-over-year in the first fiscal quarter. However, this decline was primarily due to channel inventory adjustments, with underlying demand increasing later in the quarter thanks to regional subsidies. Apple exited the quarter with lean channel inventory in China, which is expected to boost iPhone sales (sell-in) in the March quarter. Analysts estimate this could translate to approximately 1 million additional iPhone sales in China as inventory normalizes and subsidy programs drive demand.
Apple's installed base has reached an impressive 2.35 billion devices, with active installed bases for iPhone, Mac, iPad, and Watch all reaching record highs. The first fiscal quarter also saw a record number of iPhone upgraders, and iPhone 16 sales continue to outperform the iPhone 15 model. While iPhone revenue was down slightly year-over-year, this was driven by units, with ASPs actually increasing. Mac sales, driven by demand for M4-based products, grew 16% year-over-year, with double-digit growth in both upgrades and new customers.
In conclusion, Apple's strong performance in services, expanding gross margins, and resilient product portfolio, combined with the exciting potential of Apple Intelligence, create a compelling investment case. The anticipated rebound in iPhone sales in China and continued strength in Mac sales provide further positive momentum. Apple's ability to navigate macroeconomic uncertainties, capitalize on AI opportunities, and continue its track record of innovation positions the company for sustained success.
Technical Update:
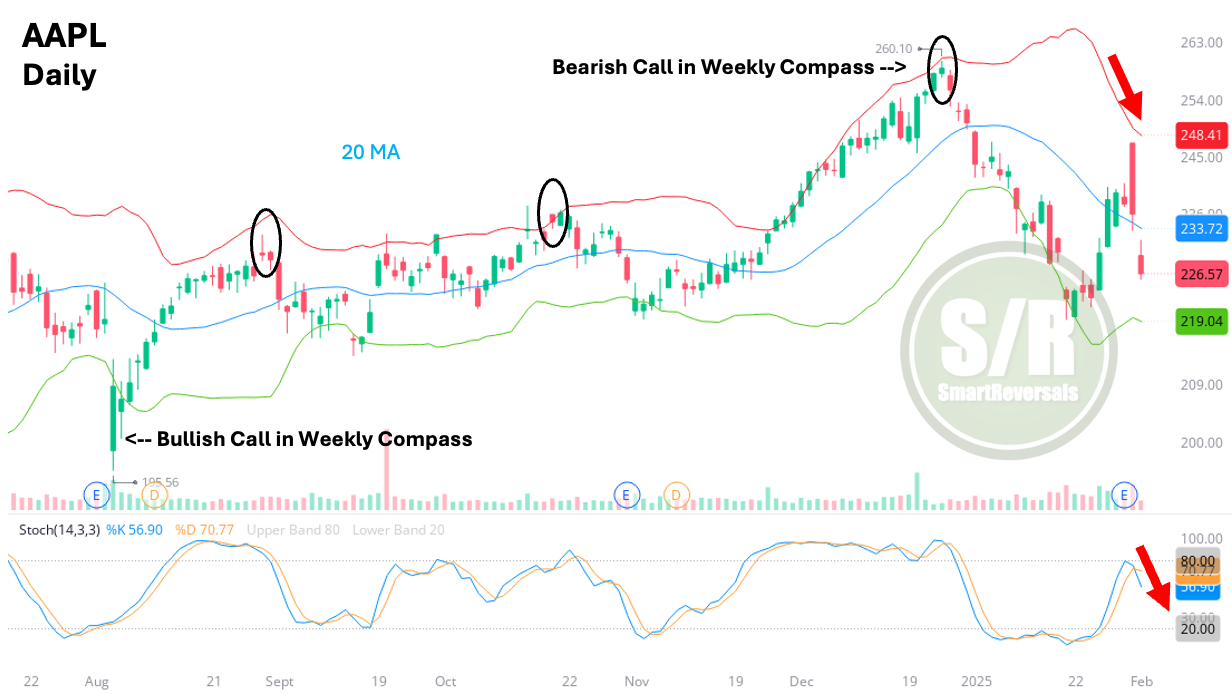
When the earnings are weak, price action moves accordingly, and the clash with the Bollinger band last Friday move price action with conviction to the south, printing a bearish setup.
Where is price action bouncing today? Close to $224.3; the bearish target set in the latest publications as a target.
Oscillators suggests the move is not complete, and the risk for a continuation to $220.5 is significant and more consistent with an oversold condition that moves price back to north.
The chart highlights also how “obedient” is this stock to technicals, that’s why the bullish call on August 5th was logic, and also the bearish one at the end of 2024 considering both daily and weekly candles aligned for a reversal. (Every publication continues in the site, you can visit the Weekly Compass menu here.
Levels Update: Immediate target for bearish continuation: $224.3, with potential continuation to $220. If there is a sustainable bounce at the $224 zone, $235 could act as a resistance, but if crossed, a bullish reversal could be considered.
Microsoft: Balancing Near-Term Challenges with Long-Term AI Dominance
Microsoft's recent performance presents a complex picture, blending promising growth drivers with temporary headwinds. While the company demonstrated resilience with total revenue of $69.6 billion (a 12% year-over-year increase) exceeding expectations, driven by Office strength and surprisingly stable performance in consumer-facing segments, Azure's 31% growth fell short of targets, landing at the lower end of guidance. This shortfall stemmed from execution issues within the partner channel, a challenge Microsoft appears confident in addressing, though it will likely impact near-term revenue. However, the core drivers of Azure's growth, notably AI workloads (now comprising 13% of growth) and large direct cloud deals, remained robust, underscoring the platform's underlying strength. The emergence of M365 Copilot as a significant revenue contributor further reinforces Microsoft's strategic position.
Looking ahead, the Q3 Azure growth forecast of 31% to 32% suggests an anticipated acceleration, even considering the softer Q2 performance. While technology shipment delays continue to exert some influence on Q3 results, the impact is no worse than anticipated, with signs of potential improvement in Q4. Commercial Office delivered a strong performance, growing 15% year-over-year and exceeding expectations, fueled by the successful rollout of Copilot. The impressive $13 billion AI revenue run rate, surpassing the $10 billion target, further validates the growing momentum of Microsoft's AI initiatives.
Operating margin, a bright spot in the recent results, reached 45.5%, exceeding forecasts by a substantial 160 basis points. This strength allows Microsoft to slightly raise its FY25 margin outlook, signaling that datacenter and operating expense efficiencies are offsetting increased capital expenditures. Consequently, FY25 capex is now projected at $87 billion (32% of revenue), up from $82.2 billion, reflecting sustained investment in growth areas.
The GPU/CPU shipment constraints that plagued the first half of the year appear to be easing. Coupled with consistent demand for core cloud migration and AI solutions, and assuming improved execution in the partner channel, Microsoft is poised for a period of more predictable and robust growth. The company's unique position, straddling both applications and infrastructure within the rapidly expanding AI landscape, positions it as a dominant player. In conclusion, while Microsoft faces some short-term obstacles, its strategic investments in AI, combined with its established cloud infrastructure and application ecosystem, create a powerful foundation for long-term success. Successfully navigating the partner channel dynamics and capitalizing on the Copilot opportunity will be key to unlocking the full potential of this position.
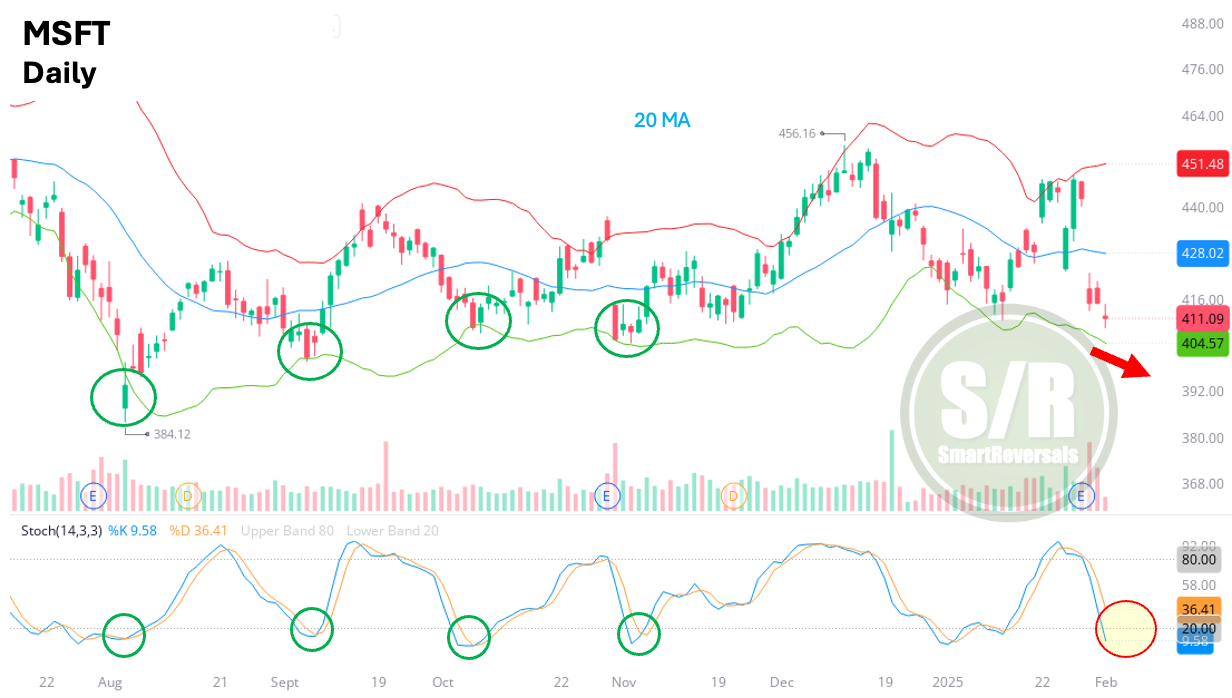
Technical Update:
Despite of the indecisive candle, this with AAPL can present the weakest setups if the Tariffs situation is perceived by the market as worsening. The Bollinger band is trending down and far from being reached as in previous bounces highlighted. The Stochastic suggests the move is not complete.
Key Levels: There is a lot of damage in the chart, $402 is the key level to manage risk if a long is considered. $425.5 may set some rejection or the 20DMA currently at $428. A solid bullish reversal may be considered in the weekly chart if $425 - $428 zone is recovered.
NFLX, META, MSFT, and AAPL were promised as open for everyone today, the next one is an invitation to continue reading as premium subscriber.
With precision, my bullish call for TSLA in the Weekly Compass, and also on X was done in the middle of so much bearishness before the earnings report, in the same way the pause for the rally was corrected timed by mid December when a consolidation was anticipated. Today, given the weak earnings report described below, some caution is key. Let’s continue with the fundamental update and the chart.
Tesla Q4 2024: Mixed Results, Future Challenges


