Two Key Levels to Invalidate Bear Market Thesis
Market Update with Educational Perspective on Moving Average Signals
Last Saturday, the Weekly Compass Anticipated:
SPX: The index today indicates a bullish continuation if the price maintains above $5,660.2, with an immediate target of $5,722.7…
The possibility for a rapid move upcoming is likely, in that case it’s worth considering $5,777.8 as the extended bullish target.
When the (extended) bullish target is reached rapidly, with a gap included, the odds for a retrace are high in weak markets, and that is what we’re seeing today; the bounce was corrective.
Weak Price Action has Been Seen Before:
The Wednesday publication from two weeks ago detailed a study of past major market corrections, highlighting recurring patterns during their early phases. The present price action demonstrates notable parallels with prior market peaks, as evidenced by rigorous metrics and technical analysis, rather than personal projections. For access, click here.
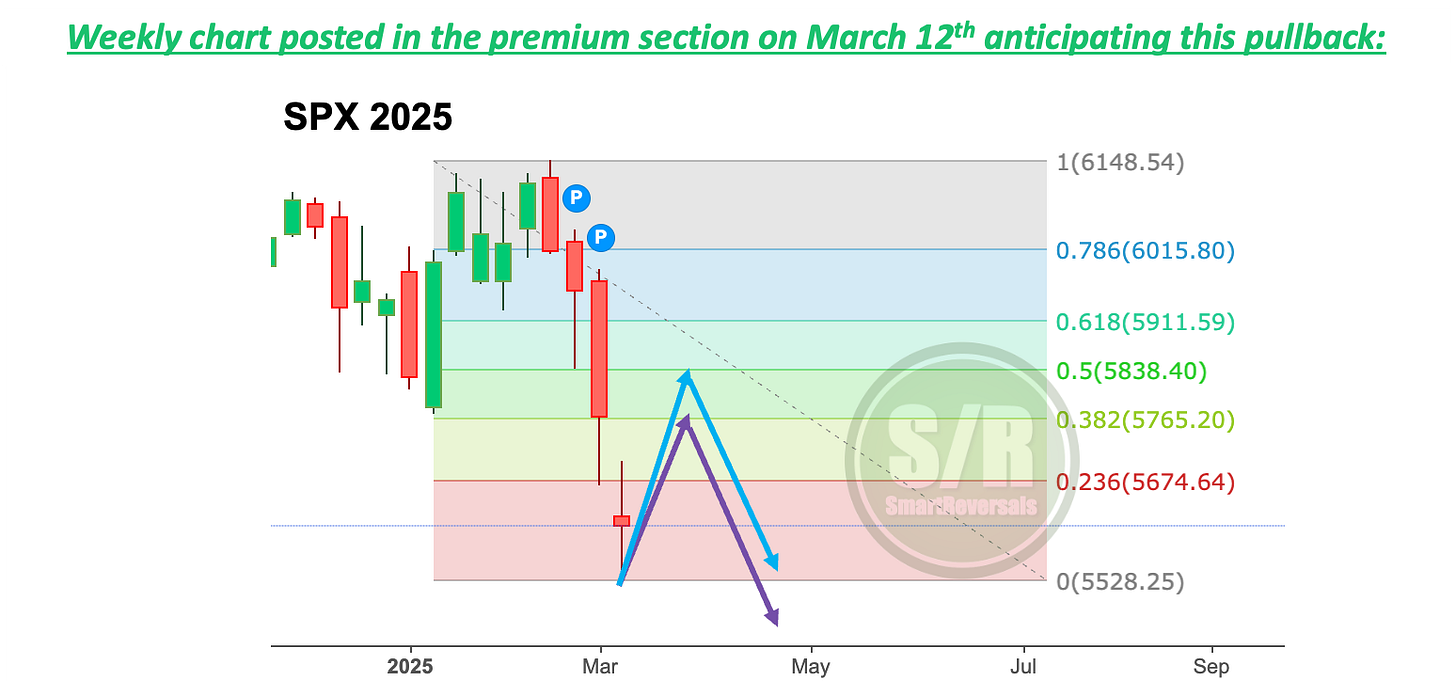
To illustrate, and based on specific references like the 2018 and 2022 corrections, the following SPX chart was presented on March 12th for 2025.
Two weeks ago the panic was at the highest level, and a bounce was projected providing two pathways, the blue one with stronger price action reaching $5,838; and the purple one with a weaker bounce reaching $5,765.
The actual rejection happened yesterday around $5,777; the second resistance line provided last Friday for this week. For access, click here.
Below you will find the updated chart, with the expected move and destination after this pullback. The bounce happened as expected, but it’s vanishing in a rapid fashion, more than expected as of today.
CROSSES
In technical analysis, "crosses" refer to instances where lines intersect on a chart, and these intersections can signal potential shifts in market trends. Here's a breakdown of bearish crosses, death crosses, and golden crosses:
Bearish Cross: A bearish cross occurs when a shorter-term moving average crosses below a longer-term moving average. This signifies that recent price action is weakening relative to longer-term trends, suggesting potential downward momentum. It's a signal that the balance of power is shifting from buyers to sellers. This can happen in various moving average crossovers, such as:
50-day moving average crossing below the 200-day moving average (as in a death cross).
Shorter-term moving averages (e.g., 20-day) crossing below intermediate-term moving averages (e.g., 50-day).
It can also occur in other oscillators like the MACD (Moving Average Convergence Divergence), where the MACD line crosses below the signal line.
Death Cross: A specific type of bearish cross where the 50-day simple moving average (SMA) crosses below the 200-day SMA. It's considered a major bearish signal indicating a potential long-term downtrend.
Golden Cross: The opposite of a death cross, where the 50-day SMA crosses above the 200-day SMA. It's a bullish signal indicating a potential long-term uptrend and it signals that short-term momentum is strengthening and could lead to a sustained upward price movement.
Today, we will study how reliable are such crosses as a signal conducting a 10 years study (2015 - 2025) for SPX, NDX, IWM, AAPL, TSLA, NVDA, DAX, and FXI. The last two are considering the rally that persists in Europe and China.
Subscribe and unlock today’s content and get access to the full library of studies; including Eliot Wave, Fibonacci, Oscillators, and more indicators. Click here.
Let’s begin with the updated chart for SPX, updating the expected price pathway until May, and the market update:
SPX
The reason why the weekly and monthly S/R levels are my main tool is because they’re dynamic and constantly updated, the fibonacci study is a good reference, but the precision is fine-tuned with them. The blue pathway seems ruled out, so let’s focus on the purple one:


