


Understanding Global Market Dynamics: Key Indices Explained
Discover Global Opportunities - India, Germany, Japan, China, Brazil, Euro Zone, Emerging Markets, and United States updated.


This publication presents a technical analysis of major international equity indices, employing Exchange Traded Funds (ETFs) as tracking instruments. It is important to acknowledge that the ETFs selected for this analysis do not represent the entirety of available tracking products for each index. However, they are investment instruments and serve as effective proxies for assessing broad market trends across diverse geographic regions.
A global perspective is essential for navigating stock market investments. This is due to several key global influences:
Economic Interdependence: The U.S. economy's strong ties to the global economy mean that international events—including geopolitical conflicts, trade disputes, and worldwide economic downturns—can have substantial repercussions for U.S. equities.
Global Supply Chain Vulnerabilities: Disruptions to international supply chains can influence companies' production expenses and profit margins, consequently affecting their stock valuations.
Foreign Exchange Dynamics: Variations in currency values can impact the competitive standing and financial performance of businesses.
Worldwide Market Psychology: Global investor confidence and anxieties can permeate overall market sentiment, influencing the trajectory of U.S. stock prices.
International Political and Natural Events: Global events like armed conflicts, political uncertainty, and natural catastrophes can introduce instability and unpredictable fluctuations within the market.
This editions includes a review of ETFs representing India (NFTY), Emerging Markets (EEM), Brazil (EWZ), Germany (DAX), Japan (EWJ), the Euro Zone (EZU), China (FXI), and the US market (SPY).
Let’s begin with a bonus chart:
USD/JPY
By the first week of July (marked by the black arrow), USD/JPY formed a doji, signaling the peak of a bearish divergence between price and oscillators. This marked the beginning of a sharp decline that bottomed in September, the decline process coincided with the carry trade situation in Japan. That pullback touched the lower Bollinger Band and continued downward until oscillators reached oversold levels, with the RSI falling from overbought (70) to oversold (30) in just two months.
Currently, we observe a bearish stochastic crossover, following a doji close to the Bollinger high. As highlighted by the black circles, indecision candles near the upper band have historically preceded significant pullbacks. Price has now found support at the 10-week moving average. If this level breaks, as suggested by price action and the oscillators, the bearish move has just begun, the target is at least $151 (the 20-week moving average) and potentially $144, where the lower Bollinger Band is projected to be in the coming weeks and where an annual level stands.
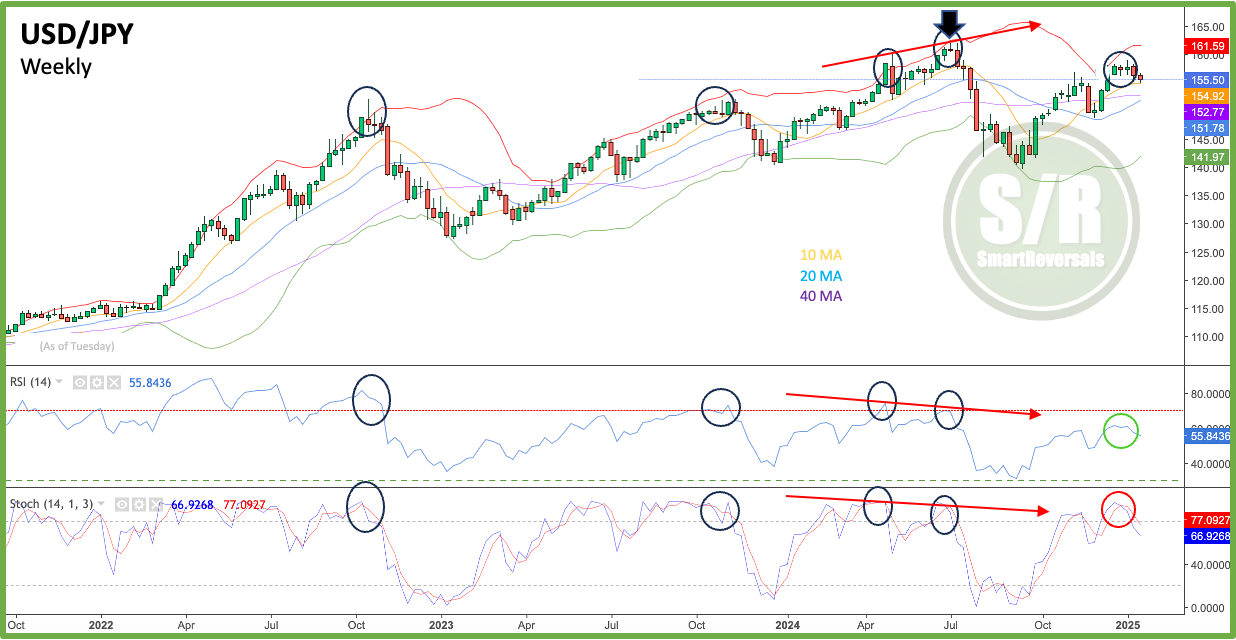
Is there a direct correlation with the indices? not necessarily, see the top in October 2022 matching with the bottom of the bear market for SPX, and while the USD/JPY was declining at the end of 2023 following again the pattern of a top, the SPX was rallying after finding the bottom of the latest 10% correction. Things were different in July/August 2024, so the question is, a selloff in this chart will be correlated with the indices like in 2024? or like in previous recent years? We’ll delve on that since there were technical patterns also in the Nikkei and SPX when the market set a top in July 2024.
Explore the following charts for ETFs tracking India, Emerging Markets, China, Germany, Japan, Brazil, the Euro Zone, and United States. Unlock deeper market insights by upgrading to the premium subscription. You'll gain access to expert chart analysis, understand current market setups, and anticipate upcoming market moves.
NIFTY
This index was presented in the Weekly Compass in October highlighting the dimension of the rally after the COVID Crash, which was stronger than SPX, back then price was overbought an a decline was likely, the question is, has the index found a bottom?