Unlocking Market Secrets: Mastering Support and Resistance Levels
Anticipate Market Movements and Improve Your Trading Accuracy
Act without emotions at critical levels: Over the past several months, paid subscribers have seen the value of using support and resistance levels. Each weekend, I publish over 22+ charts with in-depth technical analysis, carefully selecting the most relevant indicators and timeframes for each security. This approach has yielded a high probability of success. Unlike many publications that focus solely on major indices like the SPX, Bitcoin, or NDX, this publication covers a wide range of securities, allowing investors to strategically shift between overbought and oversold assets—for example, from TSLA or NVDA to GOOG or AAPL, or from PLTR to NVDA or IWM.
Support and resistance levels act as a crucial safety net, providing confirmation and preventing premature moves, especially when technical readings are challenged by unexpected price action. For instance, this publication flagged serious concerns about the SPX being overbought on December 14th, preceding a 3% decline the following Wednesday. Similarly, a bearish outlook for IWM was shared the week of November 29th, and the index has declined consistently since. In both cases, these forecasts were confirmed by the breach of the designated central level.
Given the increasing number of subscribers recognizing the effectiveness of this approach, I will be focusing this publication on the importance and application of the central level. This edition expands on previous explanations and includes an updated chart showing the central level for each week since April, demonstrating its consistent relevance. As the data clearly shows, numbers and backtested charts don't lie.
The S/R levels work for traders, as a staff works for a musician when including four spaces on which musical notation is written. The S/R levels are seven lines per week and month on which price action moves.
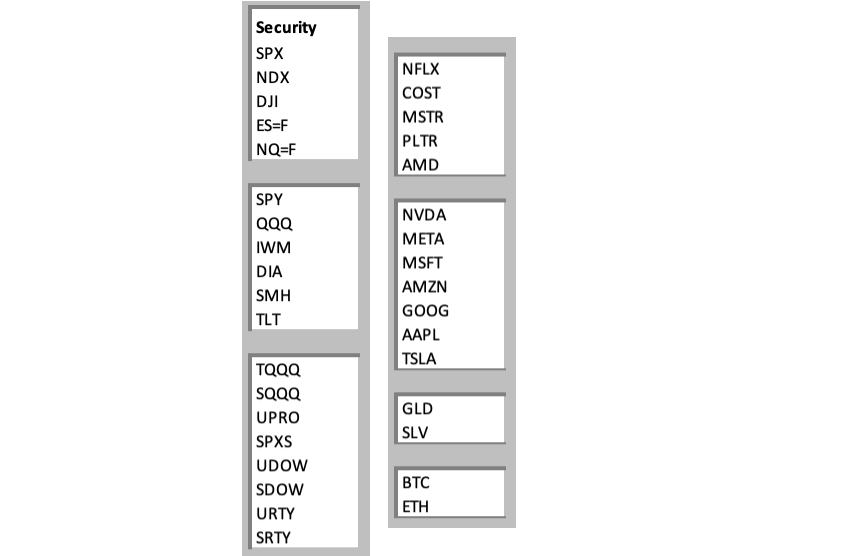
Every Friday the S/R levels are published now for the following securities, if you invest or trade in some of them, this publication is for you!
Support and Resistance Lines
They are technical analysis tools used by traders and investors to identify areas on a chart where the price of a security (Stock, ETF, Cryptocurrency, etc.) might be likely to pause or reverse.
Here's a breakdown of the concept:
Support Line: A support line is a line drawn on a price chart that connects price lows. It represents a price level where buying pressure is strong enough to prevent the price from falling further. When the price approaches the support line, there's a tendency for buyers to jump in, anticipating a bounce.
Resistance Line: A resistance line is also a line drawn on a price chart, but it connects price highs. It represents a price level where selling pressure is strong enough to prevent the price from rising further. As the price approaches the resistance line, sellers might become more active, anticipating a decline.
These lines are not guarantees of future price movements, but they can be helpful tools for identifying potential turning points in the market.
What are they useful for?:
Validate Uptrends: If the price consistently bounces off a support level during an uptrend, it validates the bullish trend. Conversely, if the price breaks below a support level, it could signal a potential reversal.
Validate Downtrends: If the price consistently bounces off a resistance level during a downtrend, it validates the bearish trend. Conversely, if the price breaks above a resistance level, it could signal a potential reversal.
Analyze Potential Reversals: When the price reaches these levels, it may reverse direction, providing potential signals for traders to enter or exit positions. Candlesticks must be analyzed and ideally an oscillator.
Watch for Breakouts and Breakdowns: A breakout occurs when the price breaks above a resistance level, while a breakdown occurs when the price breaks below a support level. These can signal significant changes in the trend.
Key Principles:
The more times a support or resistance line rejects or makes price bounce, the more validation it has. This is because repeated tests indicate a consistent level of buying or selling pressure at that price point.
At the same time, the more times a support or resistance line has been visited and temporarily breached, there are more chances of a breakdown or breakup. More attempts of crossing a line eventually bring the move that invalidates it.
Support and resistance lines can be broken. If the price decisively breaks through a support level, it can signal a potential downtrend. Conversely, a break above a resistance level can indicate a potential uptrend.
Support and resistance levels can become each other. If a support level is broken, it can sometimes become a resistance level in the future, and vice versa.
There are two good news for you":
You don’t have to stress out about calculating them, every Friday you can receive seven layers of Support and Resistance Levels for 35 securities, you just have to print them out as some subscribers do, and draw them in your charting platform for the securities you trade.
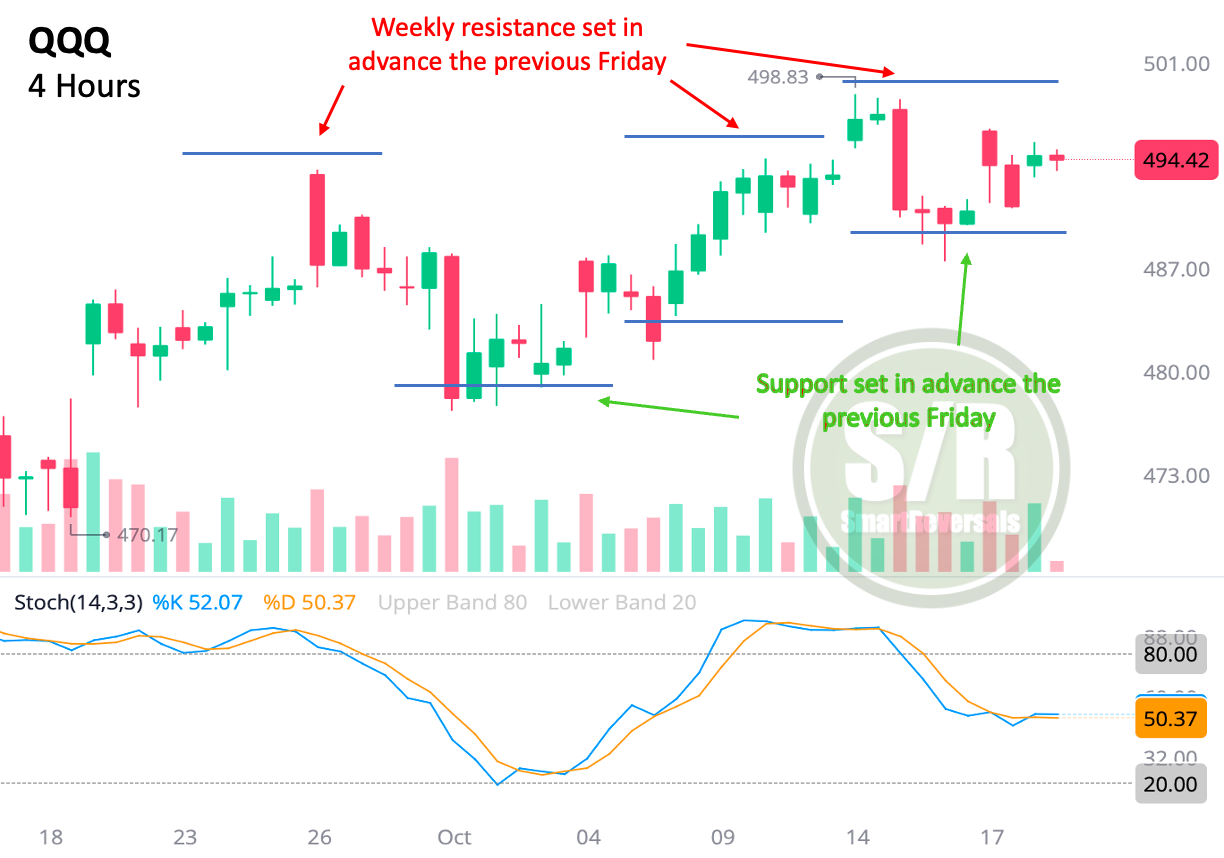
The levels provided every week are calculated ahead of time, the levels have proven to work, this example for QQQ (one of the 35 securities provided), shows weekly S/R levels provided the previous Friday.
As you see I use oscillators and candlesticks in this analysis as I do in the charts published in the Weekly Compass, other indicators like Bollinger Bands are also useful, but let’s focus on S/R levels.
The following content provides actual examples of price action relative to S/R levels for SPX, TSLA, MSFT, AMZN, and other securities, also principles to set stop losses, and an updated visual of the central highlighting its importance in my trading approach as a setup confirmation tool. Give yourself the gift of learning this holiday season. Subscribe today!
Key Elements To Consider When Using S/R Lines
1. Identify Key Levels: Start by identifying significant support and resistance levels on the price chart. Good for you, this publication sends an email every Friday afternoon with S/R levels for more than 35 securities including indexes, futures, stocks, crypto and commodities.
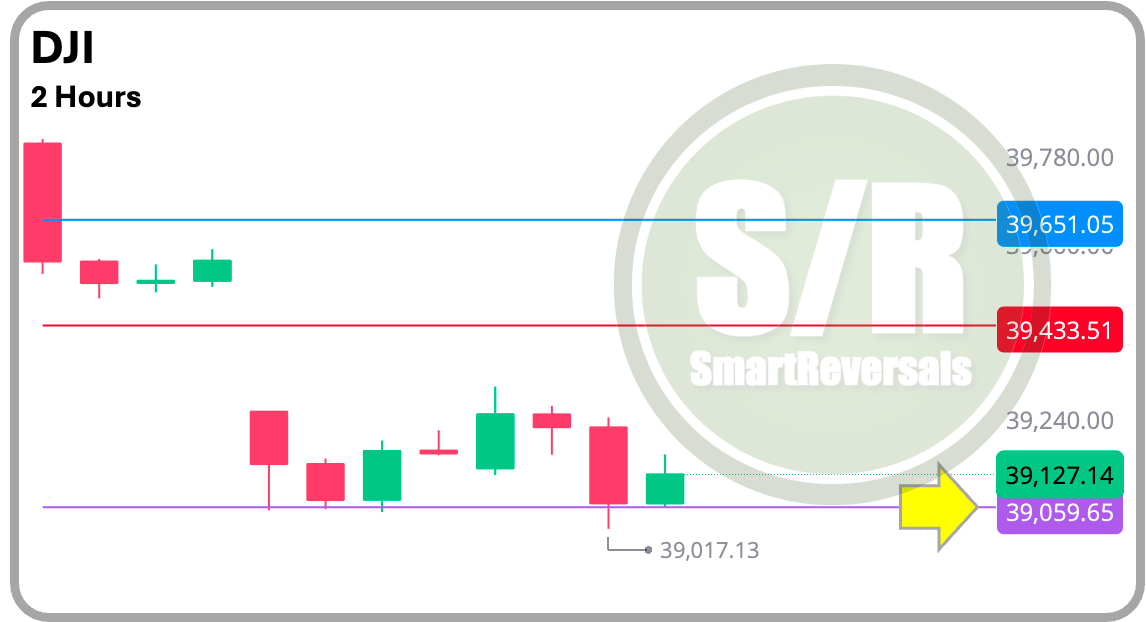
This two hours timeframe for Dow Jones shows how $39,651, the central level was breached, price started a decline that ended in the second support level (there are 3 resistance and 3 support levels next to the central level provided, in this case $39,059 supported price:
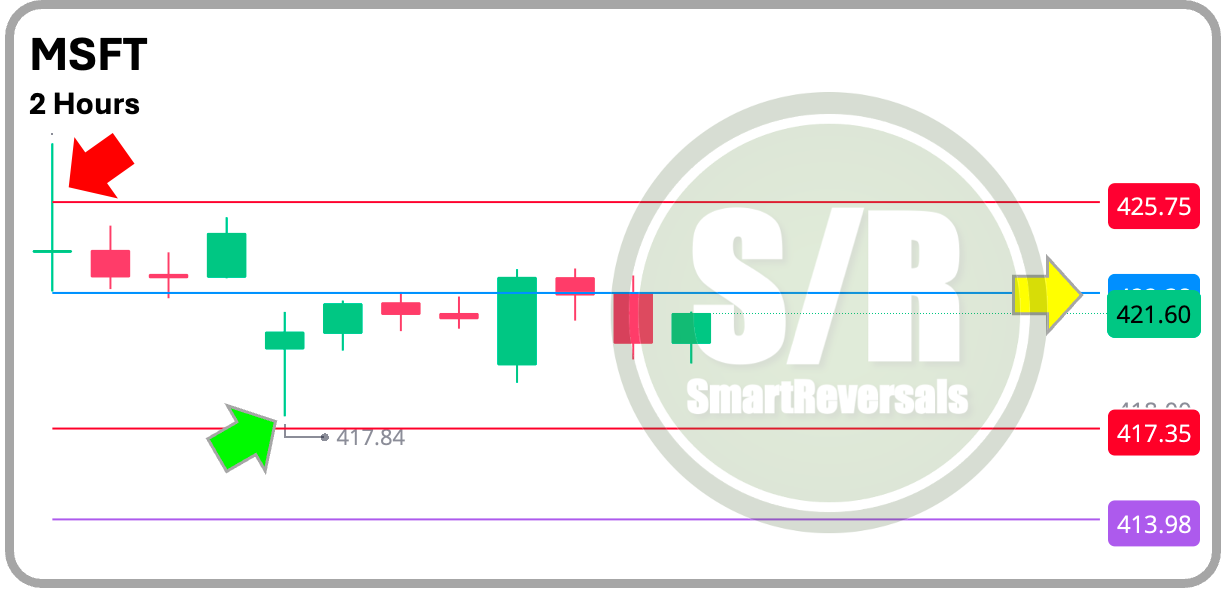
Price action has to be considered with S/R levels, it means candlesticks, they bring signals that help to validate if a level is likely to set a reversal or if it going to be breached, that’s why I constantly mention that a level has to be conquered or consolidated by a conviction candle, see the following example for MSFT, and the first candle that opened the month of April finding rejection at $425, this is an example from
The shooting star found rejection at $425.7, price moved down to the $417.4 level finding support. After a hammer candle price bounced finding resistance at $422, the central level for that week. Some traders would find more reliable to buy when the resistance is surpassed and others could buy using $417.4 as a reference for a stop loss (that means setting the stop with some distance to that level).
Why as a reference?
S/R lines work at the exact level sometimes, but in other cases price crosses the line to return quickly to the other side, just imagine the green long candle that for a couple of minutes was the first one in the following example for Amazon, the $182 level was temporarily crossed just to retrace and drawing a shooting star candle. Two days later there is another bullish attempt but a hanging man warns about a retrace.


