


U.S. Economy - 14 Macro Charts Analyzing the Landscape
Warning flags emerge for the stock market.


To navigate financial markets effectively, investors must understand the economy's health. Economic indicators provide crucial data for informed decision-making and strategic portfolio positioning.
This edition focuses on key U.S. economic indicators, grouped as leading, coincident, and lagging, to help anticipate market shifts. Leading indicators forecast future trends, coincident indicators offer real-time snapshots, and lagging indicators confirm past movements.
This report features over 14 detailed charts, clear definitions, and actionable insights, serving as a valuable, printable resource. Proactive investors subscribe now to gain a long-term technical perspective on the S&P 500 and prepare for potential market fluctuations.
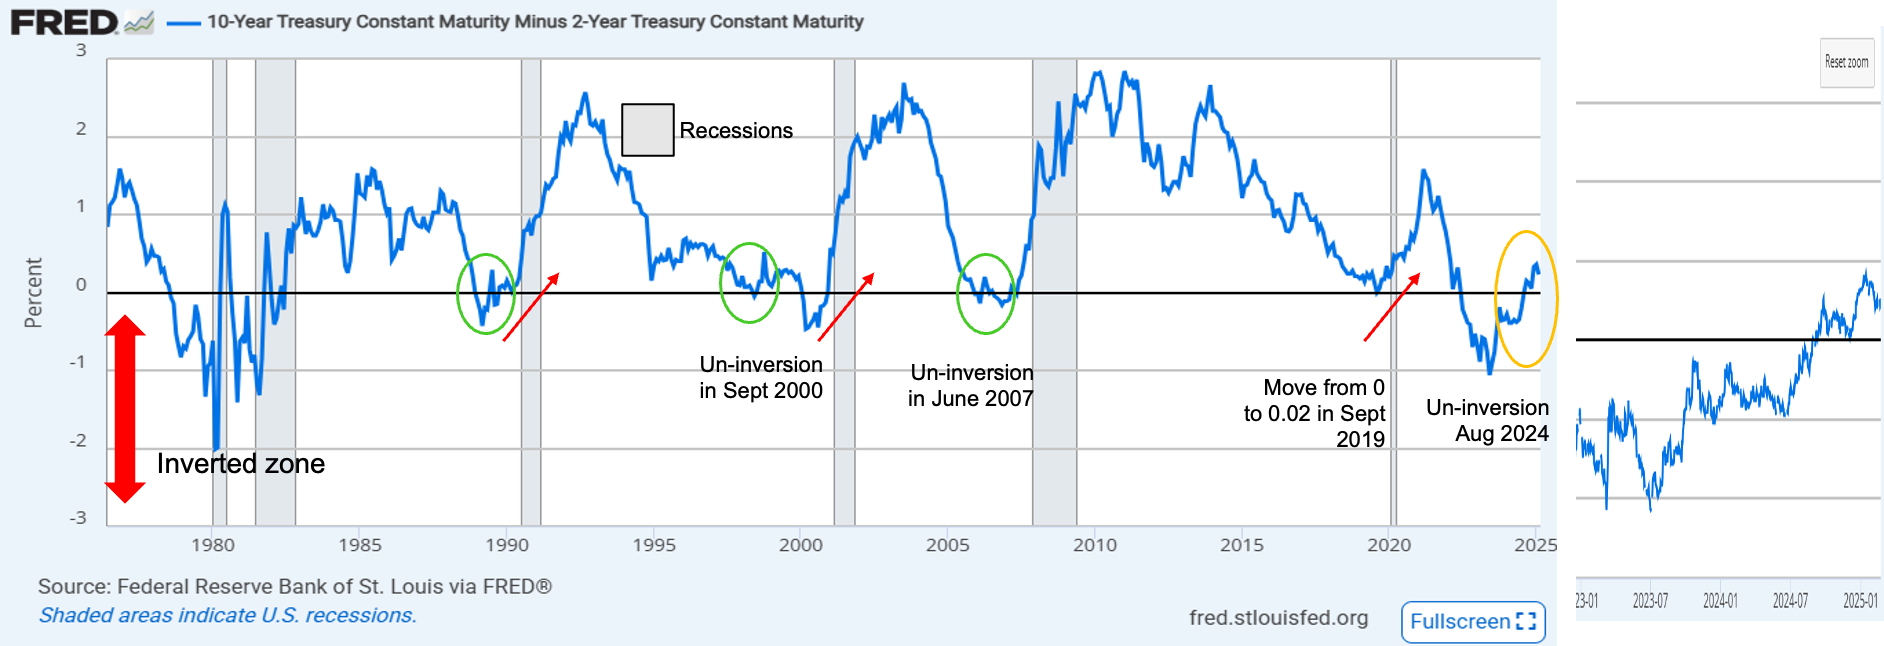
Inverted Yield Curve
An inverted yield curve, where short-term interest rates exceed long-term rates (specifically, 2-year vs. 10-year), has historically been a reliable indicator of impending recessions, as evidenced by the gray areas on the chart. While the curve's return to a normal, un-inverted state—signaled by the horizontal line crossing from below—might seem positive, it actually serves as the warning sign.
The timing of a market peak relative to this un-inversion is not fixed. For instance, in 2000, the market peaked before the un-inversion, whereas in 2007, the peak occurred three months afterward, highlighting the unpredictable nature of market responses.
The yield curve has un-inverted, a key data point among the 15+ elements we analyze today. We'll conclude with a balanced summary of bullish and bearish indicators. These are facts, not opinions, and the overall picture signals caution for the stock market.
Unlock the full analysis of charts and learn why both macro and technical indicators are raising important signals. Act now!
At the bottom of this publication, find the levels to manage SPY, SPX, NVDA, TSLA, QQQ, DIA, and IWM.