


Zweig Breadth Thrust Triggered
Is it a Trustworthy Technical Indicator for the Stock Market? - What are the Implications?

The Zweig Breadth Thrust, a notable technical indicator developed by the renowned investor Dr. Martin Zweig, serves as a powerful tool for identifying potential major turning points in the stock market, particularly marking the possible commencement of significant bull runs.
This momentum-based indicator focuses on the rapid shift in market participation. Its calculation involves examining a 10-day moving average of the ratio between the number of advancing stocks and the total number of stocks traded on a broad market exchange, such as the New York Stock Exchange. To generate this ratio, the 10-day exponential moving average (though sometimes a simple moving average is used) of advancing issues is divided by the 10-day exponential moving average of the sum of advancing and declining issues, with the result then multiplied by 100 to express it as a percentage.
This bullish signal is triggered when this calculated 10-day moving average swiftly transitions from a level below 40% to above 61.5% within a concise 10-day window. This rapid transformation signifies a dramatic change in market sentiment, moving from a state of oversold conditions and widespread pessimism to one characterized by strong and broad buying activity across a significant portion of the market.
Two weeks ago, considering the extreme volatility and market conditions recently observed, I wrote the following:
Today, you possess significantly more knowledge, perhaps gained through a challenging experience. However, this knowledge is invaluable and permanent. If you are among the persistent investors and traders who choose to continue, you will undoubtedly become more skilled with each experience. The insights I share in this publication were not learned in stable years like 2016, 2017, 2019, 2021, or 2024; they were forged during bear markets when the necessity to study more intensely became clear. It was thanks to the lessons of 2018, 2020, and 2022 that SmartReversals exists today.
Today, two weeks later, I add an additional reference:
Considering that there have been only 19 Zweig Breadth Thrust signals since World War II, experiencing the 20th just last Thursday makes you an active participant in a historically rare event. If the swift market shift feels difficult to fully grasp, remember that this occurrence marks only the 20th instance in the past 85 years.
Confusion, frustration, rejection – these are just some of the reactions I've observed when this signal appears in the market. If this is your first time encountering it, I hope you quickly adjust your market perspective and accept that after such a bearish day like last Monday, the market can roar with potentially reversal candles or gaps invalidating bearish setups. Before starting smartreversals.com, I shared the signal from November 3rd on my X account, and the some reactions were filled with denial. In the charts below, I've added what transpired after November 3rd, as well as other occurrences.
The statistical approach indicates that in every single instance, the $SPX was higher 6 and 12 months later 100% of the time. However, just two weeks ago, I shared my thoughts on the statistical approach with you: I prefer to watch the charts rather than rely on neat, simplified tables. The ones below highlight the day of the Zweig thrust with a vertical grey line.
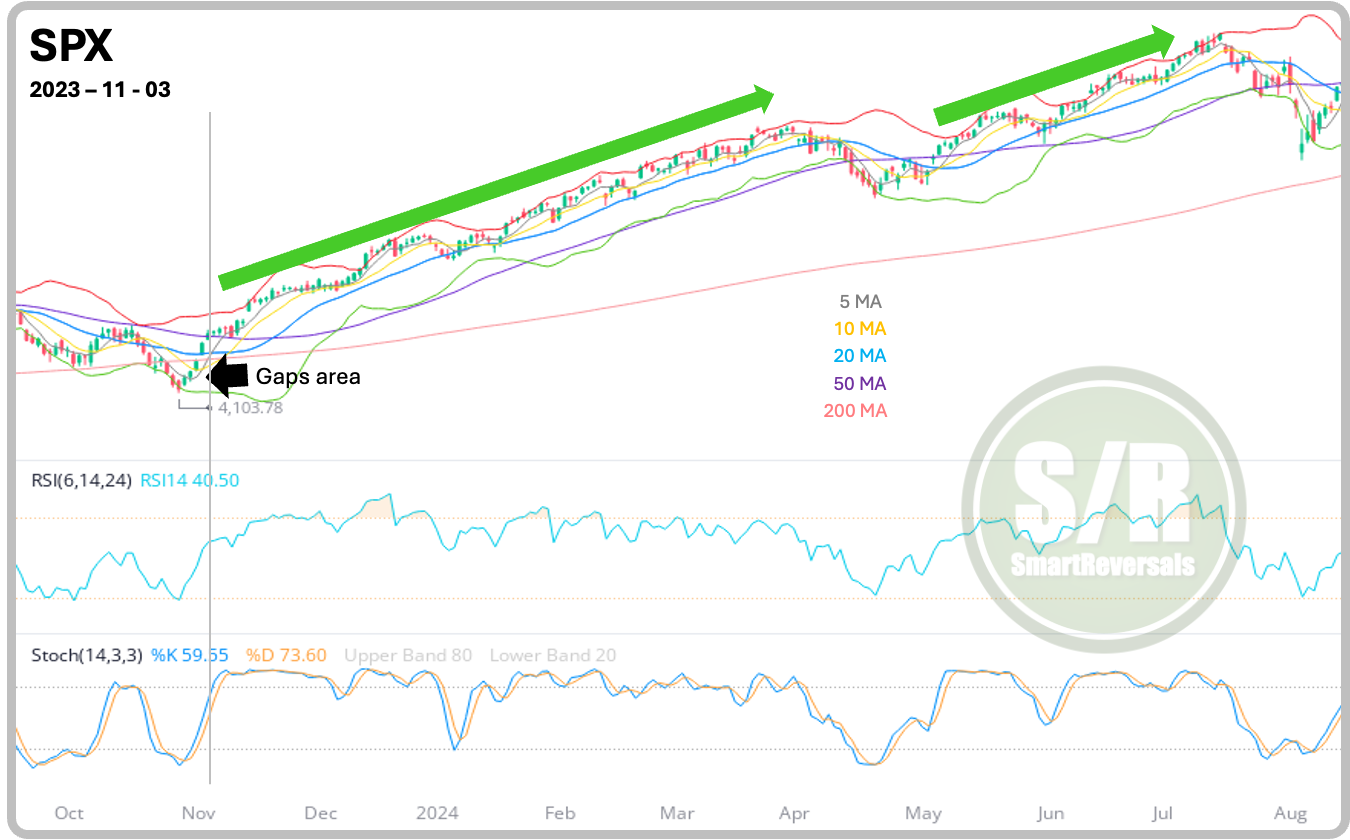
SPX - November 3rd 2023 Signal:
Having fallen 10% from its highs, the SP500 was clearly in a bearish trend. Following a bearish candle on October 27th, the market reversed aggressively the next day with a +1.2% gain, notably without a classic bullish reversal candle like a hammer or doji. This was then followed by a potentially indecisive candle. The first gap appeared the day after on November 1st, with a second gap forming on November 2nd – and as you can see, the market's subsequent trajectory is clear. Today, four gaps remain open, the lowest situated at $4,195 (black arrow).
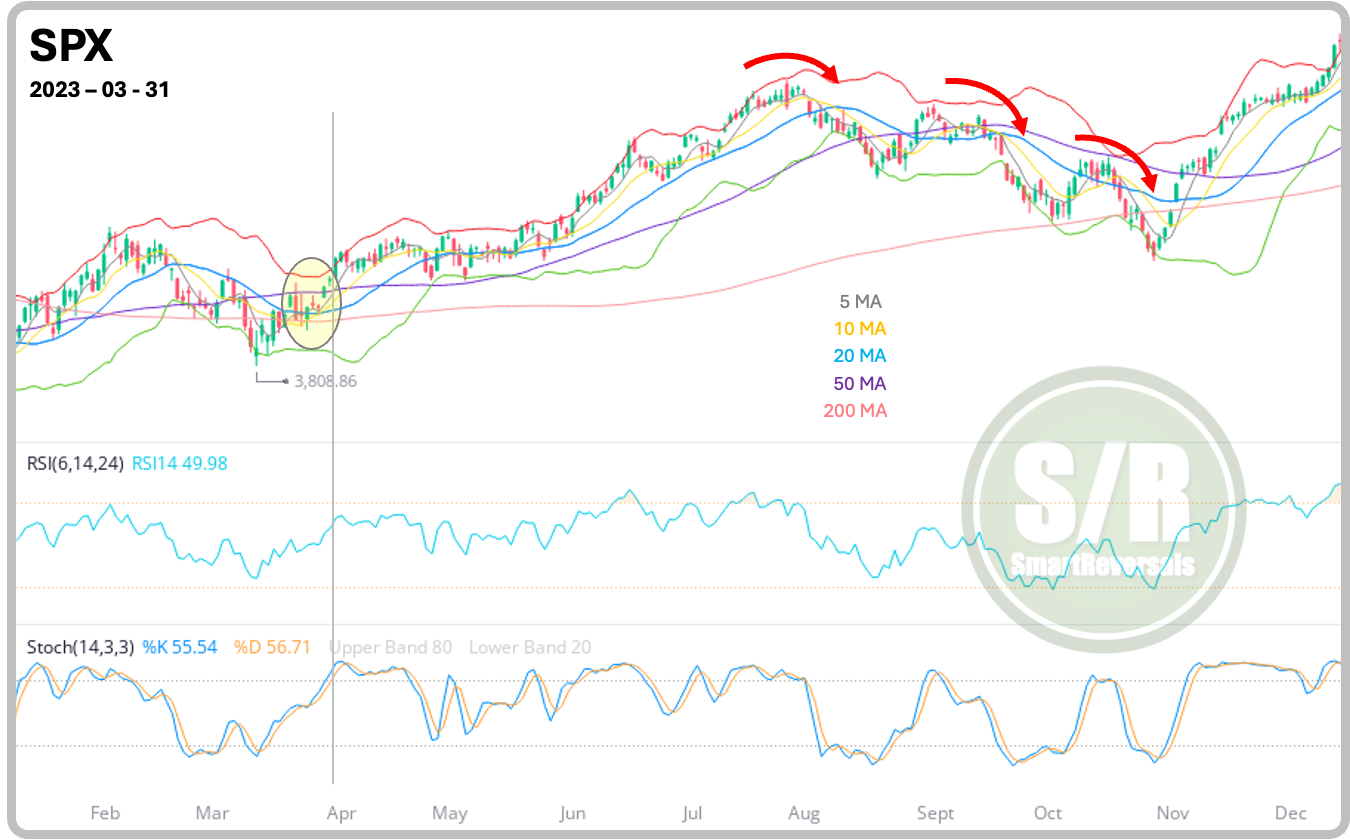
SPX - March 31st 2023 Signal:
This one is also comparable with the latest occurrence considering the choppy candles suggesting a reversal, the signal came 14 days and +8% after the bottom. If we compare with 2025, it came 12 days and +13% after the most recent bottom. Back then the market rallied to $4,607, a 10% jump that as you can see, it did not happen in a straight line up; and one year later the SP500 was higher, but with a correction in the middle; the one that preceded the following signal. 2023 was a unique year because it had two Zweig signals just for the second time in history.
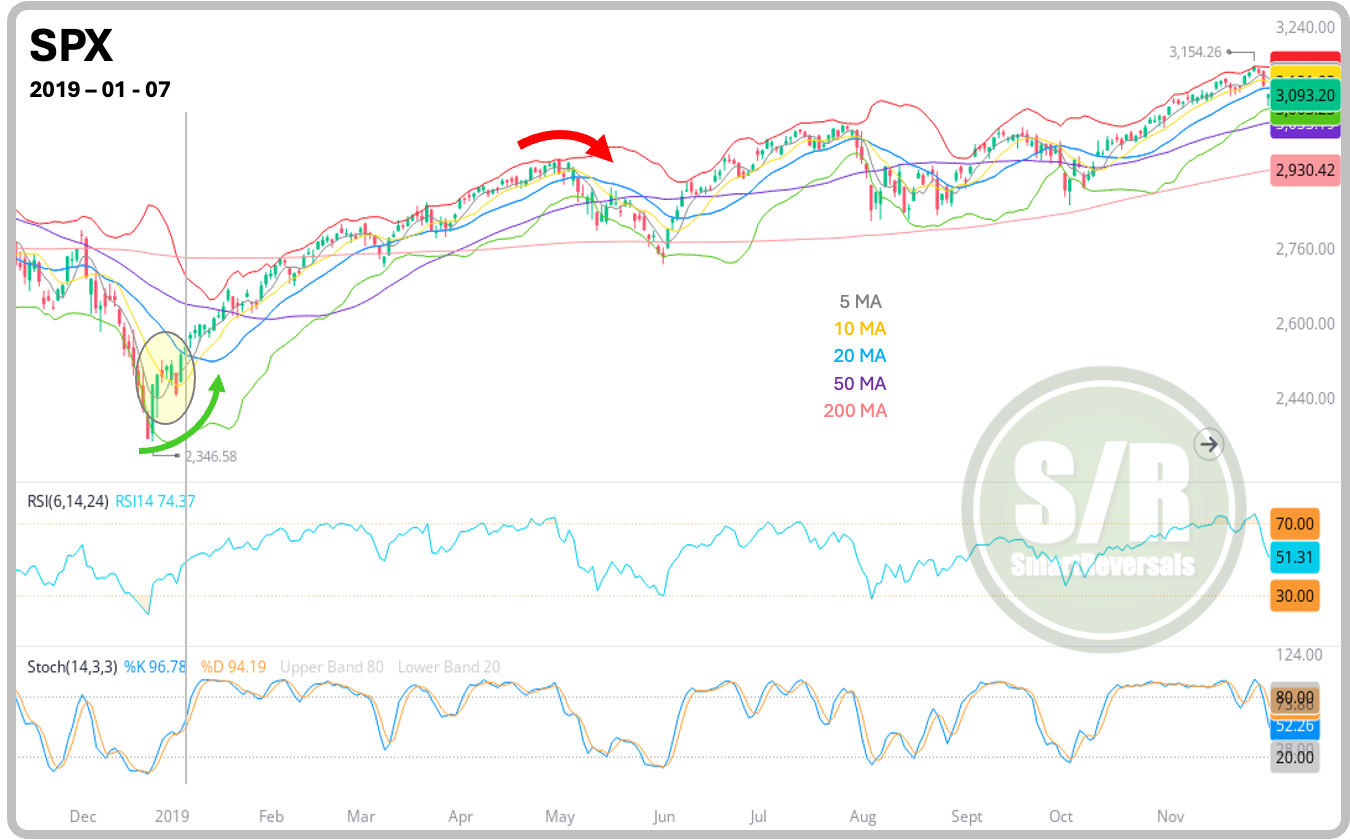
SPX - January 7th 2019 Signal:
This one is interesting, this came after the trade war 1.0, in a V shaped recovery. On January 3rd the SP 500 fell -2,48%, and on January 4th the index jumped +3.43%; sounds familiar? On January the 7th the signal came and there was a potential reversal candle (evening star) that was invalidated the next day.
If you're feeling frustrated about missing the exact bottom and letting doubt prevent you from going long, the three examples charted above might offer some comfort. They illustrate that these types of reversals often occur amidst choppy price action and setups that inspire hesitation. If that resonates with you, it's time to move forward and navigate the market that is in front of us, and not the market we want to have.
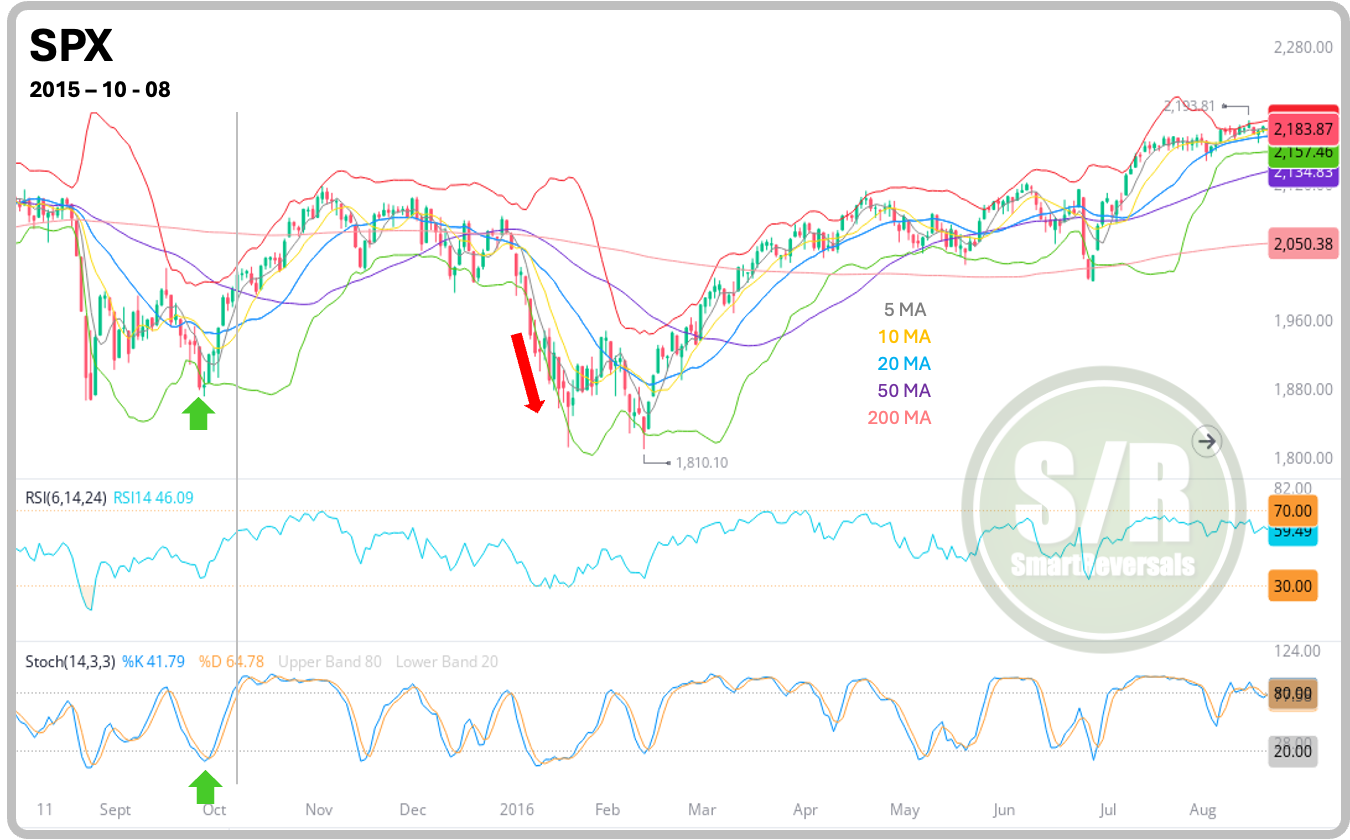
SPX - October 8th 2015 Signal:
This one was the ideal of bottoms considering the market bounced from a clear reversal candle on September 29th, and the required bounces for a Zweig signal followed in a more predictable way in terms of candlesticks. The downside of this signal, is that lower lows came just two months later, so the SPX was indeed higher six months after the signal, but just by +1.4%.
Below is the 2025 chart for the SPX, featuring updated technical analysis and considerations for potential future movements.
This publication offers in-depth technical analysis, featuring clean charts that detail current setups, including price targets and key support and resistance levels. It continues with updated charts for: SPX, VIX, DXY, NDX, IWM, DJI, SMH, PLTR, GLD, SLV, TLT, MSTR, GOOG, AAPL, NVDA, META, MSFT, AMZN, and BTC, alongside analyses of volatility and breadth indicators. If you actively invest or trade any of these securities, this publication is essential for making informed investment decisions and for identifying potential opportunities in other securities.
The weekly Support and Resistance levels for those securities and many others including NFLX, AMD, COST, TQQQ, SQQQ, ETH, SPXS, UPRO, UDOW, SDOW, URTY, and SRTY are also available for April 28th - May 2nd; click here.
SPX - April 24th 2025 Signal and What to Expect: